LCOE Is Not a Deal Price
Published cost curves rank technologies by dollars per megawatt-hour at the plant gate. A firm-power buyer pays for a firm megawatt, delivered at a site, on a date. Three adjustments reshape that comparison and reorder the ranking.
For infra funds · For hyperscalers · For developers · For utilities · firm-power · lcoe · interconnection · capacity-market · technology-cost · data-center
Kris Narayanan · Tafel Power · June 15, 2026 · 7 min read
Every serious energy shop publishes a cost curve. The national labs, the banks, the university centers, all rank technologies by levelized cost of energy, the dollars per megawatt-hour it takes to make power at the plant gate. The numbers are careful and broadly agree. For a firm-power buyer they are incomplete. A data center or a utility buying firm capacity is not buying megawatt-hours at a plant gate. It is buying a firm megawatt, at a site, on a date. Three adjustments reshape that comparison, and each one can move the ranking.
A nameplate megawatt is not a firm megawatt
Start with capacity credit. Grid operators no longer count a nameplate megawatt as a firm one, and they no longer treat the renewables alike. Effective load carrying capability, the share of installed capacity accredited toward PJM's reliability requirement, now splits solar from wind. As PJM adopted a marginal method and its winter reliability risk grew, solar accreditation fell sharply, while wind remained materially higher and storage ratings varied by duration and year. In PJM's 2027/2028 class ratings, tracking solar accredits at about 8 percent and fixed solar at 7 percent, against about 41 percent for onshore wind, 58 percent for a four-hour battery, 74 percent for gas combined cycle, and 95 percent for nuclear [2]. Capacity credit is not a physical delivery guarantee. But an 8 percent solar accreditation means a firm delivery obligation takes far more nameplate, storage, dispatchable backup, or contractual shaping than the cost curve implies.
The connection is a cost and a clock
Second, interconnection. Berkeley Lab's PJM analysis puts the mean interconnection cost for completed projects near $84 per kilowatt in 2020 to 2022, double the $42 of the prior two decades, with shared network upgrades the main driver [3]. Projects that withdrew faced substantially higher estimated interconnection costs, averaging near $599 per kilowatt in PJM, roughly seven times the completed ones. Recent completions took a median of about five years from request to operation [3][4]. That adder lands hardest on the cheap technologies, because the same dollar-per-kilowatt interconnection charge has a larger proportional effect on lower-capital-cost resources. Interconnection quietly compresses the LCOE spread the cost curves advertise.
Time to power is the price now
Third, and today the binding one, is time. For an AI load that wants power on a fixed date, the question is not what a megawatt-hour costs but when a firm megawatt shows up. Gas looks fast until you try to buy the turbine. Heavy-duty gas turbine lead times run about three years, so an order placed now arrives around 2029, and the major builders are largely booked through 2029 and 2030. GE Vernova reported 100 gigawatts of gas turbine backlog and slot reservations in the first quarter of 2026, about a fifth of it tied to data centers [5]. Solar construction can be relatively fast, but interconnection frequently governs the commercial operation date, and the output still needs storage to firm. The firm clean options, enhanced geothermal and small modular reactors, arrive later again, with the first US SMRs targeted around 2030 [7]. The cheapest energy is often the slowest firm power.
The ranking reorders
| Technology | Plant LCOE, $/MWh | Capacity credit, PJM 2027/28 ELCC | Interconnection | Time to firm power | Firm-cost read |
|---|---|---|---|---|---|
| Utility solar, firmed with storage | ~30 to 45 [1] | 7 to 8% [2] | ~$84/kW PJM completed [3] | fast to build, slow to firm | cheap energy, costly firmness |
| Onshore wind | ~30 to 50 [1] | ~41% [2] | high, ~5-yr queue [3][4] | slow to firm | cheap energy, partial firmness |
| Gas combined cycle | ~40 to 80 [1] | ~74% [2] | ~$100/kW near load [1] | turbine-limited to ~2029 [5] | competitive where inputs available |
| Gas combustion turbine | LCOE sensitive to utilization | ~61% [2] | ~$100/kW near load [1] | turbine-limited to ~2029 [5] | firm peaker, supply-constrained |
| Enhanced geothermal | high, falling [6] | dispatchable; no PJM rating | siting-dependent | ~3 to 5 yr, site-limited | emerging firm clean |
| Nuclear and SMR | first-of-a-kind, varies widely [7] | ~95% [2] | large | ~2030+ first US units [7] | firm, slow, costly early |
Read down the LCOE column and solar and wind win. Read across to delivered firm power and the order breaks up, and it breaks up within renewables too. In PJM, wind now accredits about five times tracking solar, reflecting PJM's growing winter reliability risk and the resources' different production profiles. Gas often remains competitive for firm supply where fuel, permitting, pipeline capacity, and turbines are available, and its supply is the tightest of the set. Enhanced geothermal is the emerging firm clean bet, still site limited and early, with the Department of Energy projecting its cost toward $60 to $70 per megawatt-hour by 2030 and its Enhanced Geothermal Shot targeting roughly $45 by 2035 [6]. Small modular reactors are firm and slow and, at first of a kind, expensive.
The firming cost curve
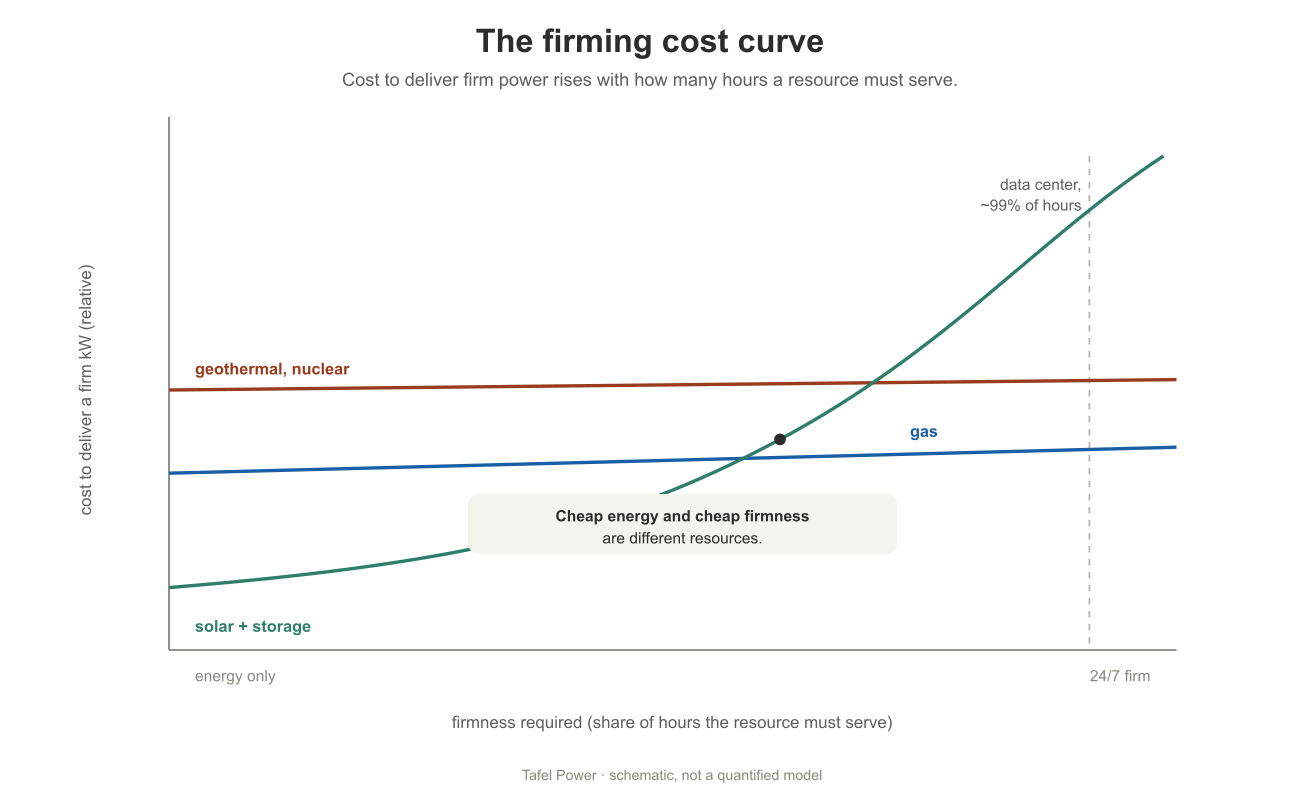
The single chart that matters plots cost against how much firmness you demand. Ask a technology for energy alone and solar is cheapest. Ask it for power in almost every hour and the solar line climbs steeply, because each increment of firmness is another block of storage. The firm resources start higher and stay flatter. Where the lines cross depends on the load, and at high availability requirements storage duration, backup supply, and portfolio diversity materially change the relative economics.
What 100 megawatts looks like
Put numbers on it. A 100-megawatt load that runs continuously, and must stay powered in almost every hour, consumes about 876,000 megawatt-hours a year. Every $10 per megawatt-hour of delivered cost then moves the annual power bill by roughly $8.8 million, and a one-year bridge-power premium of $25 per megawatt-hour runs about $21.9 million.
Capacity accreditation shows how fast the nameplate requirement diverges from the load. Under PJM's 2027/2028 class ratings, 100 megawatts of accredited capacity works out to roughly 1,250 megawatts of tracking solar, 244 of onshore wind, 172 of four-hour storage, 135 of combined-cycle gas, or 105 of nuclear [2]. These are accreditation equivalents, not physical designs or guarantees of delivery.
Storage duration moves it again, and a rating is not a guarantee. Serving 100 megawatts for four hours is nominally 400 megawatt-hours of stored energy, twelve hours 1.2 gigawatt-hours, and twenty-four hours 2.4 gigawatt-hours. A four-hour rating does not by itself provide four hours of firm coverage under every operating condition, and a project built to guarantee that coverage may need additional installed energy for round-trip losses, degradation, reserves, temperature, and charging limits.
Interconnection can be material at this scale too. At $84 per kilowatt a 100-megawatt connection is about $8.4 million, and at the $599 per kilowatt mean of withdrawn PJM projects it is nearly $60 million [3]. A small LCOE advantage disappears quickly once firmness, delay, and network-upgrade cost are in the number.
What it means for a deal
So the technology choice is set by the firmness and the date the load needs, not by the cost curve. Build a site-specific model of delivered firm cost: bring generation, interconnection, firming, and fuel to an annual basis, and weigh them against the buyer's load shape, availability target, and required date. Run that and the ranking can change materially. The resource that wins is the one that clears the firmness bar the buyer set, at the lowest all-in cost, in time. That number sits on nobody's published cost curve. It is the one the deal turns on.
Methodology
Plant costs and capacity factors are from the NREL 2024 Annual Technology Baseline. Capacity credit figures are PJM's 2027/2028 ELCC class ratings, which use a marginal method and vary by ISO and by year. Interconnection cost is from Berkeley Lab's PJM territory analysis, and queue duration from its Queued Up work. Gas turbine lead times and backlog are from GE Vernova's first-quarter 2026 disclosures. Geothermal and SMR cost and timeline figures are from the Department of Energy and NREL analysis. Every figure is a directional range, not a point estimate, and delivered firm cost is a framework for a specific deal rather than a published number. Location, availability target, and date move the answer, and the firming chart is a schematic of the relationship, not a quantified model.
Sources
- NREL, 2024 Annual Technology Baseline (plant LCOE, capacity factors, and the $100/kW near-load grid-connection assumption for gas).
- PJM, ELCC Class Ratings for the 2027/2028 Base Residual Auction (tracking solar 8%, fixed solar 7%, onshore wind 41%, four-hour storage 58%, gas combined cycle 74%, gas combustion turbine 61%, nuclear 95%).
- Lawrence Berkeley National Laboratory, Interconnection Cost Analysis in the PJM Territory (January 2023): completed-project mean of $42/kW in 2000 to 2019 rising to $84/kW in 2020 to 2022, and a withdrawn-project mean near $599/kW.
- Lawrence Berkeley National Laboratory, Queued Up: a median near five years from interconnection request to commercial operation for recent completions.
- GE Vernova first-quarter 2026 disclosures (reported April 2026): 44 GW of gas turbine backlog plus 56 GW of slot reservations, totaling roughly 100 GW, about a fifth tied to data centers, with heavy-duty lead times near three years and 2029 to 2030 slots largely booked.
- US Department of Energy, Pathways to Commercial Liftoff: Next-Generation Geothermal (2024): enhanced-geothermal cost projected toward $60 to $70/MWh by 2030, with the DOE Enhanced Geothermal Shot technology target of about $45/MWh by 2035.
- US Department of Energy and NREL analysis, with project announcements (X-energy and Dow, Holtec Palisades, Kairos) pointing to first US SMRs around 2030 and first-of-a-kind costs above large-reactor levels.
All figures compiled by Tafel Power from public sources, informed by the firm's transaction advisory work in ERCOT and cross-ISO markets.
Questions, corrections or disagreement on any of this are welcome: kris@tafelpower.com
More from Insights
June 11, 2026
PJM's Largest Data Center Market Is Relying on the Existing Fleet, Not New Gas
For hyperscalers and infra funds in PJM: Northern Virginia leads PJM in forecast data-center demand growth and has almost no signed, near-term merchant gas behind it.
May 14, 2026
In MISO, the Firm Gas Is in the Utility Plan, Not the Queue
For data centers and infra funds looking at the Midwest and Gulf: MISO's interconnection queue shows almost no signed, near-term merchant gas, yet Louisiana is building more new gas than any state in the country.