How Much of ERCOT's 69.7 GW Gas Queue Is Credible?
Apply the historical post-IA completion rate to signed gas and a conservative request-to-operation base-rate weight to unsigned gas, and 69.7 GW becomes about 17 GW on a completion-weighted basis.
For hyperscalers · For infra funds · For developers · ercot · gas · deliverability · underwriting
Kris Narayanan · Tafel Power · July 11, 2026 · 5 min read
This is a method to do that weighting in the open, with rates anyone can check, rather than private factors taken on faith.
Two weights, from the queue's history
Weight each project's nameplate by one of two rates, drawn from the project-level record of about 3,600 gas interconnection requests in the LBNL Queued Up dataset. Signed capacity gets the historical completion rate for gas that has executed an interconnection agreement; unsigned capacity gets a conservative base rate, the overall rate from initial request to operation.
| Project status | Underwriting weight | Basis |
|---|---|---|
| Signed interconnection agreement | 60% | Rounded historical completion rate among resolved post-IA gas capacity |
| No signed agreement | 15% | Conservative overall request-to-operation base rate, not a measured in-study stage rate |
Rates are capacity-weighted, and the two use different denominators by design. The signed-agreement rate is computed on resolved projects only: among gas capacity that reached an executed interconnection agreement and has since resolved, 185 GW is operating against 107 GW withdrawn, a completion rate of about 63 percent. That rate is closer to 58 percent on the older cohorts that have fully settled (149 GW operating against 106 GW withdrawn). We round to 60 percent. For in-study capacity we take a deliberately conservative figure: the overall rate from initial request to operation across all gas requests, about 15 percent, which keeps still-unresolved requests in the denominator. That is not a measured in-study stage rate, since a project that completes necessarily signs an agreement first; it is the base rate for capacity that has not yet cleared that milestone, used as an underwriting weight. A signed agreement is the strongest public maturity signal a queued project offers, and even so, historically more than a third of signed capacity has not been built.
Applied to the June 2026 ERCOT gas queue
The 69.7 GW of gas nameplate is 14.6 GW with a signed agreement and 55.1 GW without one. Weight each by its rate, 14.6 GW at 60 percent and 55.1 GW at 15, and the result is about 17 GW of completion-weighted queued gas, roughly a quarter of the headline. Across a reasonable range of rates, from a conservative 58 and 15 to a generous 64 and 18, it runs 17 to 19 GW, never close to 69.7.
This is completion-weighted queued gas, not supply anyone can contract. It counts all gas in the queue, including capacity that will be built for a single owner and never offered to the market. Captive self-build for a data center sits in this figure the same as merchant gas, because it is in the same queue.
For the capacity a merchant buyer can actually screen for this cycle, apply a hard filter instead: full credit only for signed, merchant gas online by 2028, zero for everything else. That is 8.8 GW, the same figure as the screened-set analysis. It is a strict, near-term screen, not a forecast; at the 60 percent signed-completion rate, even that set is likely to deliver less.
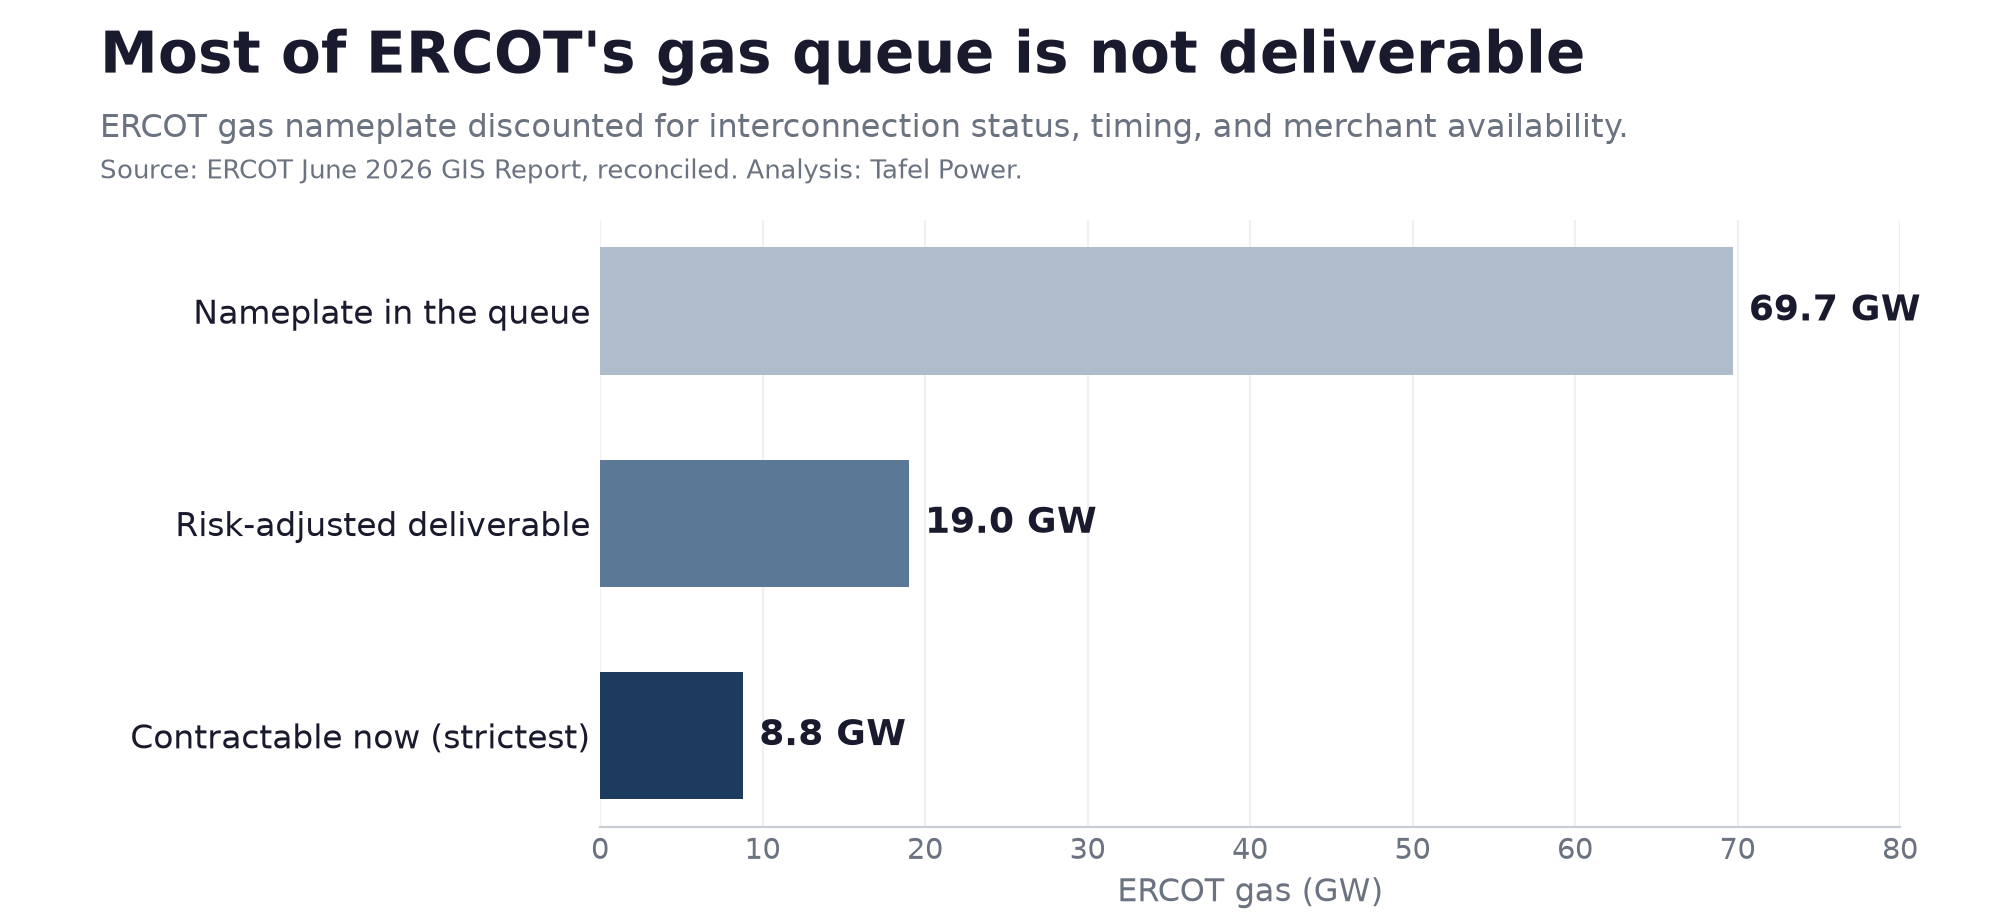
The weights are transparent and stressable
The point of anchoring to these weights is that they are inspectable and arguable. They are computed from the LBNL project-level record as described above: a resolved-only completion rate for signed capacity, and a conservative base rate for unsigned. On the US gas sample a signed agreement completes about 60 percent of the time; on the ERCOT subset the rate runs higher, though that sample is smaller. Lower the signed rate to 55 percent and the total falls; raise it and it rises; across any reasonable setting the completion-weighted figure sits near a fifth to a quarter of nameplate. What publishing the rates removes is the ability to hide the discount behind a private number.
What the rates do not capture
These rates describe historical gas-queue outcomes on average. Dedicated self-build can break the normal interconnection signal: a captive project may stay unsigned in the queue while being commercially committed through an offtake, air permit, and equipment order. Such capacity receives the 15 percent unsigned-project weight yet is far likelier to build, so the completion-weighted figure is a portfolio-level underwriting estimate, not a project-specific forecast. Captive builds need a separate screen.
What this changes for each user
Hyperscaler energy leads. Plan against completion-weighted capacity, about 17 GW, not the nameplate, and against the 8.8 GW you can actually screen for merchant supply. Both are defensible denominators sourced to rates a counterparty can check.
Infra funds. Underwrite a gas platform on its completion-weighted capacity, and stress the rates rather than the nameplate. Under this framework, in-study megawatts receive a 15 percent conservative base-rate weight that should be stress-tested.
Developers. The method prices exactly what you hold. Historically, projects with signed agreements have completed at a materially higher rate than projects measured from initial request, so a signed position carries more development certainty than an unsigned one.
This is one of a four-Brief series on the firm-power decision: how much capacity is credible, what powers a 24/7 data center, who controls the screened merchant set, and where the load should sit.
Methodology
Inputs are drawn from the LBNL Queued Up 2026 project-level dataset (about 3,600 gas interconnection requests across US ISOs). The signed-agreement weight is operating capacity divided by operating plus withdrawn capacity among resolved projects that executed an interconnection agreement, about 60 percent (58 to 64 percent by cohort). The unsigned weight is the overall request-to-operation ratio across all gas requests, about 15 percent; it keeps still-active capacity in the denominator and is used as a conservative base-rate assumption for unsigned capacity, not a measured stage-specific completion rate. Both weights are capacity-weighted. These rates are applied to the ERCOT June 2026 GIS Report gas queue (Large and Small Gen, Full Interconnection Study requested), reconciled against an archived snapshot of that source, split into 14.6 GW with a signed interconnection agreement and 55.1 GW without. The 17 GW completion-weighted figure counts all queued gas regardless of owner or offtake, and is a completion estimate, not merchant supply. The 8.8 GW screen additionally requires merchant ownership and a 2026 to 2028 in-service date. Neither is an ERCOT-published category. The screened set identifies projects meeting public queue criteria; it does not establish that the capacity is uncontracted, commercially available, financed, equipment secured, fuel secured, or physically deliverable to a particular load. Figures reflect the June 2026 snapshot and may have changed since.
All data compiled by Tafel Power from public sources. Framing informed by the firm's transaction advisory work in ERCOT and cross-ISO markets.
Questions, corrections or disagreement on any of this are welcome: kris@tafelpower.com
More from Insights
July 10, 2026
The Second-Largest Signed, Near-Term Gas Queue Is in the Plains
For data centers willing to look past the marquee markets: SPP holds more signed, near-term gas than PJM and MISO combined, mostly in Oklahoma and the Texas Panhandle.
July 9, 2026
ERCOT's Signed, Near-Term Merchant Gas Is a Fifteen-Counterparty Market
For hyperscalers and infra funds procuring firm power: when the screened merchant set sits with a countable number of counterparties, price discovery is shaped more by relationship, timing, and project-specific alternatives than by broad competition.