How a Utility Gets Paid
A regulated utility earns on one equation with three terms, and one of them moves far more than the others. Across nineteen large US utilities the allowed rate of return sits in a narrow band while rate base varies by nineteen times even after setting the two smallest aside. So the ranking of who earns most is a rate base ranking, and that decides which structures a utility can say yes to.
For infra funds · For developers · For hyperscalers · For utilities · project-economics · capital · procurement · large-load · cost-allocation
Kris Narayanan · Tafel Power · September 16, 2026 · 20 min read
In brief
The decision. Before pricing anything with a regulated utility, establish which commission sets its return and whether your structure adds to or substitutes for its rate base. Those two facts predict the shape of the deal better than any cost estimate does.
A regulated utility is paid on one equation, and it has three terms.
Allowed earnings = rate base x equity portion of that base x allowed return on equity
Rate base is the capital a regulator has agreed customers should pay for. The other two terms decide what share of that capital earns a shareholder return and at what rate.
One of the three terms moves far more than the others. Run the equation across the nineteen large US utilities where the rate base, the equity share and the return on equity can be taken from the same jurisdiction on a compatible basis, and the rate of return is close to a constant. Allowed equity earnings run from 3.94 to 5.46 cents per dollar of rate base, a spread of 1.39 times, and eleven of the nineteen sit between 4.9 and 5.3 cents. Nine states, nine commissions, different politics in each. Outside Texas they cluster around five cents, and the five Texas wires companies sit near four, which is the one real separation in the set. Rate base over the same nineteen runs from $0.31bn to $71.4bn. Set the two smallest aside and it still spreads about 19 times.
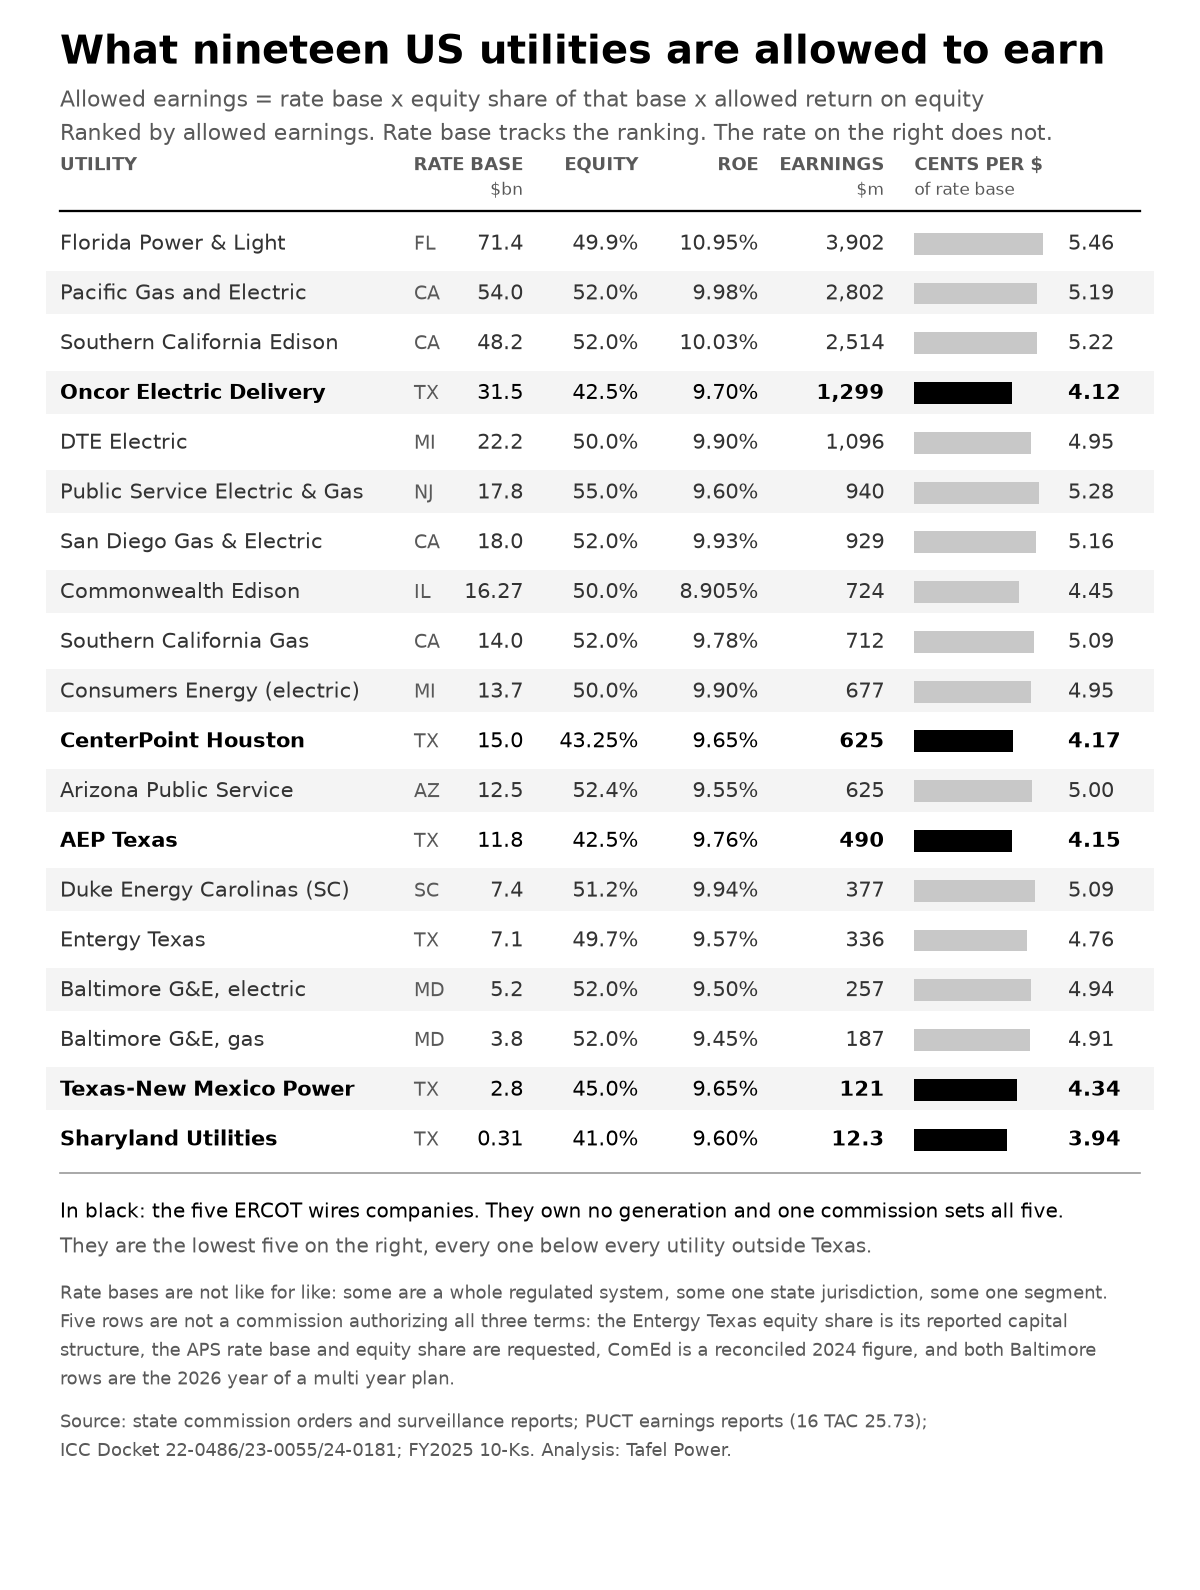
So the earnings ranking is a rate base ranking. Not a ranking of operating skill, of rate cases won, or of customers served. Florida Power and Light is allowed $3.90bn a year. Commonwealth Edison, serving Chicago, is allowed $724m. The gap is 5.4 times, and the rates behind it differ by 1.2 times.
What follows for anyone on the other side of the table. If the return rate sits in a narrow band and the base is what varies, the durable earnings engine of a utility is not primarily generating electricity cheaply. It is getting capital approved into rate base. Three consequences a counterparty can act on:
- Structure beats price. The same megawatts offered as a contract and as a utility owned asset with your credit behind it are worth very different amounts to the counterparty. The second often clears faster even when it looks dearer per megawatt hour.
- The docket is the transaction. Who funds interconnection and network upgrades is worth more than a decade of operating terms, and it is decided in a proceeding rather than a negotiation.
- A proposal that substitutes for their capital will not be talked round. A merchant plant, a long term contract, self supply behind the meter or a bypass is misaligned with how they are paid. That is arithmetic, not a negotiating posture.
One worked proof. ComEd asked the Illinois Commerce Commission for $15.4bn to $18.3bn of rate base at a 10.50% to 10.65% return. It received $13.8bn at 8.905%, litigated for a year, and won back roughly $544m of revenue requirement by changing which rate base the forecast ran on. It won nothing at all on the return, which was still under appeal at Exelon's last annual report. The argument about the size of the base was worth half a billion dollars. The argument about the rate has so far been worth nothing.
The nineteen
Allowed equity return, largest first. A row appears only where the rate base, the equity share and the return on equity come from the same jurisdiction on a compatible basis. That is a weaker test than a single commission order, and the rows where it matters are named below the table.
| # | Utility | State | Rate base ($bn) | Equity | Allowed ROE | Allowed earnings ($m) | Per $ of rate base |
|---|---|---|---|---|---|---|---|
| 1 | Florida Power & Light | FL | 71.4 | 49.9% | 10.95% | 3,902 | 5.46% |
| 2 | Pacific Gas and Electric | CA | 54.0 | 52.0% | 9.98% | 2,802 | 5.19% |
| 3 | Southern California Edison | CA | 48.2 | 52.0% | 10.03% | 2,514 | 5.22% |
| 4 | Oncor Electric Delivery | TX | 31.5 | 42.5% | 9.70% | 1,299 | 4.12% |
| 5 | DTE Electric | MI | 22.2 | 50.0% | 9.90% | 1,096 | 4.95% |
| 6 | Public Service Electric & Gas | NJ | 17.8 | 55.0% | 9.60% | 940 | 5.28% |
| 7 | San Diego Gas & Electric | CA | 18.0 | 52.0% | 9.93% | 929 | 5.16% |
| 8 | Commonwealth Edison | IL | 16.27 | 50.0% | 8.905% | 724 | 4.45% |
| 9 | Southern California Gas | CA | 14.0 | 52.0% | 9.78% | 712 | 5.09% |
| 10 | Consumers Energy (electric) | MI | 13.7 | 50.0% | 9.90% | 677 | 4.95% |
| 11 | CenterPoint Energy Houston Electric | TX | 15.0 | 43.25% | 9.65% | 625 | 4.17% |
| 12 | Arizona Public Service | AZ | 12.5 | 52.4% | 9.55% | 625 | 5.00% |
| 13 | AEP Texas | TX | 11.8 | 42.5% | 9.76% | 490 | 4.15% |
| 14 | Duke Energy Carolinas (SC) | SC | 7.4 | 51.2% | 9.94% | 377 | 5.09% |
| 15 | Entergy Texas | TX | 7.1 | 49.7% | 9.57% | 336 | 4.76% |
| 16 | Baltimore Gas & Electric, electric | MD | 5.2 | 52.0% | 9.50% | 257 | 4.94% |
| 17 | Baltimore Gas & Electric, gas | MD | 3.8 | 52.0% | 9.45% | 187 | 4.91% |
| 18 | Texas-New Mexico Power | TX | 2.8 | 45.0% | 9.65% | 121 | 4.34% |
| 19 | Sharyland Utilities | TX | 0.31 | 41.0% | 9.60% | 12.3 | 3.94% |
The quantity kinds are not identical and it matters. FPL's $71.4bn is the Florida retail jurisdiction only. PG&E's $54.0bn is the general rate case base and excludes FERC transmission. The Michigan and Texas figures are jurisdictional. Five rows are not a commission's authorization of all three terms, in four groups, and each is load bearing somewhere in what follows:
- Entergy Texas. The 49.7% is the capital structure its own PUCT earnings report states, not an authorized equity ratio. No authorized ratio was located. Read the in-state comparison below as a contrast with an actual structure rather than with something the Commission set.
- Arizona Public Service. The $12.5bn and the 52.4% are from the 2025 rate case filing, so they are what APS requested, and only the 9.55% return is from the February 2024 order. Requested is not authorized. This row carries the Arizona entry in the "eleven utilities across six states" count below; without it that reads ten across five.
- Commonwealth Edison. The $16.27bn is a reconciled actual figure for 2024 rather than a forward test year. Its equity share and return are from the order; see the method section.
- Baltimore Gas and Electric. Both rows are the 2026 year of a multi year plan rather than a current authorization.
Ranking these orders regulated positions, not companies.
The rate of return is effectively a national constant
Look down the last column. Once the equity share and the return on equity are multiplied together, the range collapses.
| Term | Range | Spread |
|---|---|---|
| Allowed return on equity | 8.905% to 10.95% | 1.23x |
| Equity share of rate base | 41.0% to 55.0% | 1.34x |
| The two combined | 3.94% to 5.46% | 1.39x |
| Rate base | $0.31bn to $71.4bn | 230x |
| Rate base, excluding the two smallest | $3.8bn to $71.4bn | 19x |
| Allowed earnings | $12.3m to $3,902m | 317x |
The two terms that get argued over in rate cases, testified about by cost of capital witnesses, and written up when a commission rules, together move the answer by a third. The term that gets less attention in comparisons moves it by nineteen times.
Both ends of the range are Texas or Florida. Sharyland sits at 3.94% because the PUCT allows it 41% equity, the thinnest layer in the set, and Oncor at 4.12% on 42.5%. FPL sits at 5.46% because Florida allows both a high return and a thick equity layer. Between those ends, eleven utilities across six states land within forty basis points of each other. Whatever process produces these numbers, it is producing the same number.
Texas is the cleanest test, and it is not the test you would expect
Texas restructured its ERCOT market, so the utilities inside it own no generation. The obvious prediction is that this shrinks rate base and therefore earnings. Half of that is right.
The part that is wrong is the ranking. Oncor is wires only and sits fourth, because its territory is enormous and its rate base is compounding faster than anything else in the set. On the PUCT's Earnings Monitoring Report basis, as quoted in Sempra's 10-K because the report itself is a scan, it went from $23.1bn at the end of 2023 to $26.6bn at the end of 2024, with $31.5bn estimated for 2025. That is 36% in two years, a 16.8% compound rate. FPL's average rate base grew about $5.5bn in 2025, roughly 7.7%. Hold both rates for five years and Oncor's allowed earnings roughly double while FPL's rise about 45%. Restructuring did not make Texas a small business. It made it a volume business.
Where restructuring does show up is the rate, and the mechanism is the equity layer rather than the return on equity. Six Texas utilities, one commission:
| Utility | Structure | Equity | Allowed ROE | Per $ of rate base |
|---|---|---|---|---|
| Sharyland Utilities | ERCOT wires only | 41.0% | 9.60% | 3.94% |
| Oncor | ERCOT wires only | 42.5% | 9.70% | 4.12% |
| AEP Texas | ERCOT wires only | 42.5% | 9.76% | 4.15% |
| CenterPoint Energy Houston Electric | ERCOT wires only | 43.25% | 9.65% | 4.17% |
| Texas-New Mexico Power | ERCOT wires only | 45.0% | 9.65% | 4.34% |
| Entergy Texas | MISO, vertically integrated | 49.7% | 9.57% | 4.76% |
One commission regulates all six. It authorizes every ERCOT wires company between 41% and 45% equity, the thinnest layers in this study. The vertically integrated utility in the same state runs a normal layer, and that last figure is a weaker kind of evidence: 49.7% is the capital structure Entergy Texas reports, not a ratio the Commission authorized, and no authorized ratio was located. So the comparison is between five authorized layers and one actual one. Entergy Texas is allowed a lower return on equity than Oncor, 9.57% against 9.70%, and its reported structure still produces 64 basis points more per dollar of plant, because it funds seven more points of that plant with equity.
The separation is clean. Rank all nineteen by earnings per dollar of rate base and the bottom five are the five ERCOT wires companies, in a row, every one of them below every utility outside Texas.
The cleanest pair in the set makes the point twice. Oncor and ComEd are both pure electric wires companies in restructured states, and both commissions publish the whole capital structure, so the two can be compared all the way down rather than on the headline alone.
| Oncor | ComEd | |
|---|---|---|
| Authorized equity | 42.5% | 50.00% |
| Authorized ROE | 9.70% | 8.905% |
| Cost of long term debt | 4.39% | 4.22% |
| Overall rate of return | 6.65% | 6.572% |
| Allowed equity earnings per $ of rate base | 4.12% | 4.45% |
Texas allows the higher return on equity, by 80 basis points, and produces the lower equity earnings per dollar of plant, by 33. The headline number ranks the two backwards. The overall rate of return, which is what the customer actually funds, puts them within eight basis points of each other. Three ways of asking the same question, two different answers, and the one that gets quoted is the one that decides least.
Texas is also not uniformly deregulated, which is easy to miss. Entergy Texas sits in MISO, Southwestern Electric Power and Southwestern Public Service in SPP, and El Paso Electric in WECC. All still own generation. The same commission authorizes AEP Texas, wires only, at 9.76%, and Southwestern Electric Power in Texas, vertically integrated, at 9.25%. On the return on equity alone the company carrying generation risk is allowed 51 basis points less, which is the opposite of what a risk story predicts. The 9.25% is from AEP's own subsidiary disclosure. The equity layers for the integrated Texas utilities were not obtained: PUCT control number 57406 carries earnings reports for the ERCOT wires companies and Entergy Texas but not for these, and no other path was tried, so treat that as an observation about the return and not about total compensation.
Why utilities do what they do
If the return rate moves within a narrow band and the base is what varies, five behaviours follow. None of them requires anyone at a utility to be cynical. They are what the equation pays for.
Capital beats operations. A dollar of approved plant is allowed to earn about five cents a year for decades. A dollar of avoided operating cost does not earn that, because operating costs are a pass-through and any saving is reset at the next rate case. A utility can hold a saving for a while through regulatory lag, a performance incentive, a formula mechanism or an efficiency sharing band, and those are real money. What they are not is a stream that compounds for thirty years. Reliability improvement does not automatically increase allowed equity earnings unless it supports additional recoverable investment or an incentive mechanism. This is why utility strategy documents are capital plans and why the investor presentation leads with rate base growth rather than with any operating measure.
Owning beats contracting. A power purchase agreement is generally an operating expense and does not enter traditional rate base. The same megawatts built and owned do. On $2bn of generation that is roughly $100m a year of allowed equity earnings against a contract that produces none. The qualification matters: some jurisdictions attach a purchased power incentive, a rider, or an allowed margin on procurement, so the contract is not always worth zero to the shareholder. It is reliably worth less than owning. When a utility resists a merchant developer's offer and proposes to build instead, the equation is doing the talking.
Getting things into the base beats getting them cheap. The economically important fight is often whether capital enters rate base, at what amount, and on what schedule. Prudence and reasonableness are part of that fight, but they are rarely where the money is. ComEd's Illinois case is the clearest worked example in the set, because it ran long enough to separate the two.
In December 2023 the Illinois Commerce Commission rejected ComEd's grid plan. ComEd had asked for $15.4bn to $18.3bn of average rate base at a 10.50% to 10.65% return with 50.58% to 51.19% equity. It received $13.8bn at 8.905% with 50%. Because the Commission set the 2024 to 2027 forecast on ComEd's approved 2022 year end rate base, the cumulative revenue requirement increase came to $501m, which was $986m less than ComEd had asked for.
Then ComEd litigated for a year, and only one of the two terms moved. Rehearing was denied on every issue except the use of the 2022 year end rate base. On 18 April 2024 the Commission approved the forecasted 2023 year end rate base instead, which raised the revenue requirements. On 19 December 2024 it approved the Refiled Grid Plan, and the cumulative increase settled at $1.045bn against the $1.487bn originally requested.
So ComEd won back roughly $544m of revenue requirement by changing which rate base the forecast ran on. It won nothing on the return. The 8.905% and the 50% equity ratio were carried straight through into the December 2024 order, which reaffirmed both and put ComEd's overall rate of return at 6.572% for the 2024 test year. Both remained under appeal in the Illinois Appellate Court as of Exelon's FY2025 Form 10-K, filed 12 February 2026, which records that no deadline binds the court. That is the asymmetry in one docket: the argument about the size of the base was worth half a billion dollars, and the argument about the rate has so far been worth nothing.
Load growth is the best thing that can happen. A large new customer does two things at once. It justifies more plant, which grows the base, and it spreads existing fixed costs over more sales, so the residential bill can hold flat or fall while the utility earns more. That is why a regulated utility generally has a strong economic incentive to serve a large new load such as a data center, and it is why the contested question is usually not whether to serve the load. It is the large load tariff: minimum take, term, exit fees, collateral, and who funds the interconnection.
Where the rules are best, the capital goes. FERC incentives can allow construction work in progress in rate base for qualifying transmission projects, so a return is earned during construction rather than at commercial operation, and can allow abandonment recovery, so a project that is never built can still be made whole. Neither is automatic and both are granted project by project. Where they are granted, that is an unusually favourable risk position, and it is not a secret. It explains a great deal about where utility capital is heading.
What this means across the table
The three consequences in the summary are the short version. Two things are worth adding before anyone uses them.
The first is that alignment is a spectrum rather than a switch. A utility will sign a power purchase agreement, and does so routinely, when it has no realistic way to build or when a commission has told it to procure competitively. What the equation predicts is not refusal. It is where the effort goes: which option gets the favourable study assumption, which one the utility argues for in testimony, and which one moves quickly. A structure that grows the base does not have to be cheaper to win. It has to be defensible.
The second is that the commission is a party to your deal whether or not it is in the room. The return rate is set in a proceeding you are not part of, and the allocation of interconnection and network upgrade cost is decided the same way. In the ComEd case the whole year of litigation moved one term and left the other untouched, and the term it moved was worth roughly $544m. A counterparty who has read the last rate order knows which arguments have already been tried in that jurisdiction and which are still open. That is cheaper diligence than a cost model and it predicts more.
The decision this supports: before pricing anything with a regulated utility, establish which commission sets its return and whether your structure adds to or substitutes for its rate base. Those two facts predict the shape of the deal better than any cost estimate.
Method, and the part that is missing
Every figure is from a company SEC filing, a commission document, or a utility's own published disclosure to investors. No commercial research or ratings data. The four Michigan links and the Virginia link below are news releases rather than the orders themselves, and the AEP Texas row rests on AEP's subsidiary disclosure rather than on a commission document. The FY2025 Form 10-K of twenty five utility holding companies was checked, all filed in February 2026, and the Texas figures come from the earnings reports those utilities file with the PUCT under 16 TAC section 25.73.
One trap worth naming, because it would have changed the ranking. Florida authorizes FPL a 59.6% equity ratio, and that number is quoted widely. FPL's own surveillance report shows common equity of $35.6bn against a rate base of $71.4bn, which is 49.9%. Both are right. Florida leaves deferred taxes, customer deposits and investment tax credits inside the capital structure at zero cost, so 59.6% is equity as a share of investor supplied funds only. California subtracts deferred taxes from rate base instead. Multiplying Florida's rate base by Florida's stated 59.6% gives $4.66bn rather than $3.90bn, a 19% overstatement that looks entirely plausible and survives every check except reading the capital structure schedule. The table uses the equity dollars FPL states directly.
The ComEd row was re-pulled and is the one row on a different basis. Its rate base is not a forward test year figure. The Commission's December 2023 order set the 2024 to 2027 forecast on ComEd's 2022 year end rate base, which produced the $13.8bn quoted in Exelon's own 8-K. That figure was superseded twice, by the order on rehearing of 18 April 2024 and by the Order on Refiling of 19 December 2024, and the approved forward rate base lives in Appendices A to D of that order, which are filed separately and could not be retrieved from the ICC paths tried. The $16.3bn used here is ComEd's jurisdictional rate base for reconciliation year 2024, $16,267,495,000, from Schedule 3 of the appendix to the proposed order in Docket 25-0383. The Commission's final order in that docket issued on 18 December 2025. Exelon's FY2025 10-K records that it approved a revenue increase of $243m. That order was not retrieved here, so the rate base figure should be replaced with its schedule when the document can be read. The equity share and the return on equity do not depend on any of this: 50.00% and 8.905% are stated in Finding of Fact 6 and Section XVI.B of the December 2024 order, so the 4.45% per dollar of rate base is firm and only the dollar total is provisional.
Allowed is not earned. FPL's surveillance report shows an earned return on common equity of 11.70% against its 10.95% set point. CenterPoint Houston's earnings report shows 7.82% against a 9.65% authorization, and Entergy Texas 8.03% against 9.57%. Regulatory lag and how much capital moves through riders rather than waiting for a general rate case separate the earned figure from the allowed one, and the equation captures neither. Public Service Company of Colorado, which is not in the table, reported 5.66% for 2025 and 7.55% on Xcel's ongoing measure, and is quoted here without an authorized comparison because the returns in Xcel's filing are mostly requested rather than granted.
What could not be assembled. All twenty five holding companies disclose an authorized return on equity somewhere. Fewer than half disclose a rate base that can be paired with it. Dominion, DTE at the parent level, NiSource, Alliant in dollar terms and PPL for its largest segment disclose none.
The largest positions still missing:
- Georgia Power. Return on equity 10.50% and equity ratio 56%, both published, and no current rate base anywhere. Georgia publishes retail rate base in the utility's Annual Surveillance Report; the most recent one retrievable here is 2020, at $20.8bn, which predates both Vogtle units entering service. Paths tried: the PSC facts document search, three services API endpoints, the 2025 commission annual report, and two document searches. The current figure exists and is not reachable this way.
- Oncor and AEP Texas file as images. Both 2024 PUCT earnings reports are scans with no text layer. AEP Texas is nonetheless in the table above, because AEP publishes rate base and authorized return by subsidiary in its own investor disclosure. Oncor's rate base comes from Sempra's 10-K quoting the same report. Neither figure is read from the filing itself.
- Virginia Electric and Power. The Commission set 9.80% in the 2025 biennial review, Case PUR-2025-00058, decided 25 November 2025, up from 9.70%. No rate base appears in the order summary or in Dominion's 10-K, and the final order itself has not been read.
- Consolidated Edison of New York. Rate base disclosed as a rate plan target, roughly $26.1bn electric and $9.6bn gas in year one. The matching authorized return was not located in the 10-K, and the rate plan order was not retrieved.
So the term that drives nearly all of the spread is the one that is hardest to get, and in several large states is not published at all, or is published as a picture. That asymmetry is a fair part of why this sector is discussed in terms of allowed return on equity. It is what there is to discuss, and as the table shows, it is close to the least informative number in the equation.
Sources
Commission documents. The four Michigan links are the Commission's news releases on those orders rather than the orders themselves; the rate base figures for those rows come from the FY2025 10-Ks listed below.
- FPL Rate of Return Surveillance Report, February 2026, Docket 20250011-EI, Order PSC-2026-0022-S-EI
- FPL 2025 rate settlement filing, Florida PSC Docket 20250011-EI
- PUCT Control Number 57406, year-end 2024 electric utility earnings reports under 16 TAC section 25.73: CenterPoint Energy Houston Electric, item 11, Entergy Texas, item 3, Texas-New Mexico Power, item 2, Sharyland Utilities, item 63
- MPSC news release on the DTE Electric rate order, Case U-21297, 1 December 2023
- MPSC, DTE Electric, Case U-21860, 19 February 2026
- MPSC news release on the Consumers Energy electric rate order, Case U-21389, 1 March 2024
- MPSC, Consumers Energy, Case U-21870, 27 March 2026
- Virginia SCC news release, 2025 biennial review of Dominion Energy Virginia, Case PUR-2025-00058
- Georgia PSC, Summary Report on Georgia Power's 2020 Annual Retail Surveillance Report
- ICC, Order on Refiling, Docket Nos. 22-0486/23-0055/24-0181 (Consol.), 19 December 2024. Capital structure and rate of return at Section XVI.B; equity ratio and ROE at Finding of Fact 6. Appendices A to D, which carry the approved rate base, are filed separately and were not retrieved. Paths tried: the docket entry listing, which is behind a CAPTCHA, and four adjacent file identifiers in the same entry, all of which redirect.
- ICC, proposed order appendix, Docket 25-0383, ComEd annual performance evaluation, 4 November 2025. Jurisdictional rate base for reconciliation year 2024 at Schedule 3, line 24. The Commission's final order of 18 December 2025 was not retrieved; the same paths were tried.
Company filings.
- Exelon Form 8-K, 14 December 2023, ICC final order on ComEd's multi-year rate plan and MDPSC order on BGE
- FY2025 Form 10-K filings, all filed February 2026, for NextEra, Duke, Southern, Dominion, AEP, Exelon, Xcel, PG&E, Edison International, Sempra, Entergy, Consolidated Edison, WEC, DTE, PPL, FirstEnergy, Ameren, CMS, Eversource, CenterPoint, PSEG, Evergy, NiSource, Alliant and Pinnacle West, retrieved from EDGAR. Rate base, authorized return and capital structure figures are quoted from these except where a commission document is cited above.
Questions, corrections or disagreement on any of this are welcome: kris@tafelpower.com
More from Insights
September 13, 2026
Batteries, Generators, or Demand Response? What the Tariff Measures Decides
Transmission exposure runs from one peak hour a year to every megawatt hour consumed. The shape of what gets measured decides which instrument can reach it, and sometimes none of them can.
September 11, 2026
A Texas Power Plan Can Cost 9.8 Cents. Or 22.2.
Across the 57 plans priced this way, that is the median at 1,000 kWh against the median at 500. The difference is how much you use that month. I downloaded all 1,053 plans on the state's Power to Choose site to find out how common this is.