ERCOT Fleet Revenue Rose 8 Percent. Revenue per Megawatt Fell 37 Percent.
Total storage revenue keeps rising, but largely because capacity is added faster than per-unit revenue falls. The underwriting error is treating a market revenue forecast as if it described your asset. What still earns depends on which edge an asset holds and how fast it erodes.
For infra funds · For developers · For hyperscalers · For utilities · ercot · storage · bess · asset-valuation · asset-edge
Kris Narayanan · Tafel Power · July 23, 2026 · 8 min read
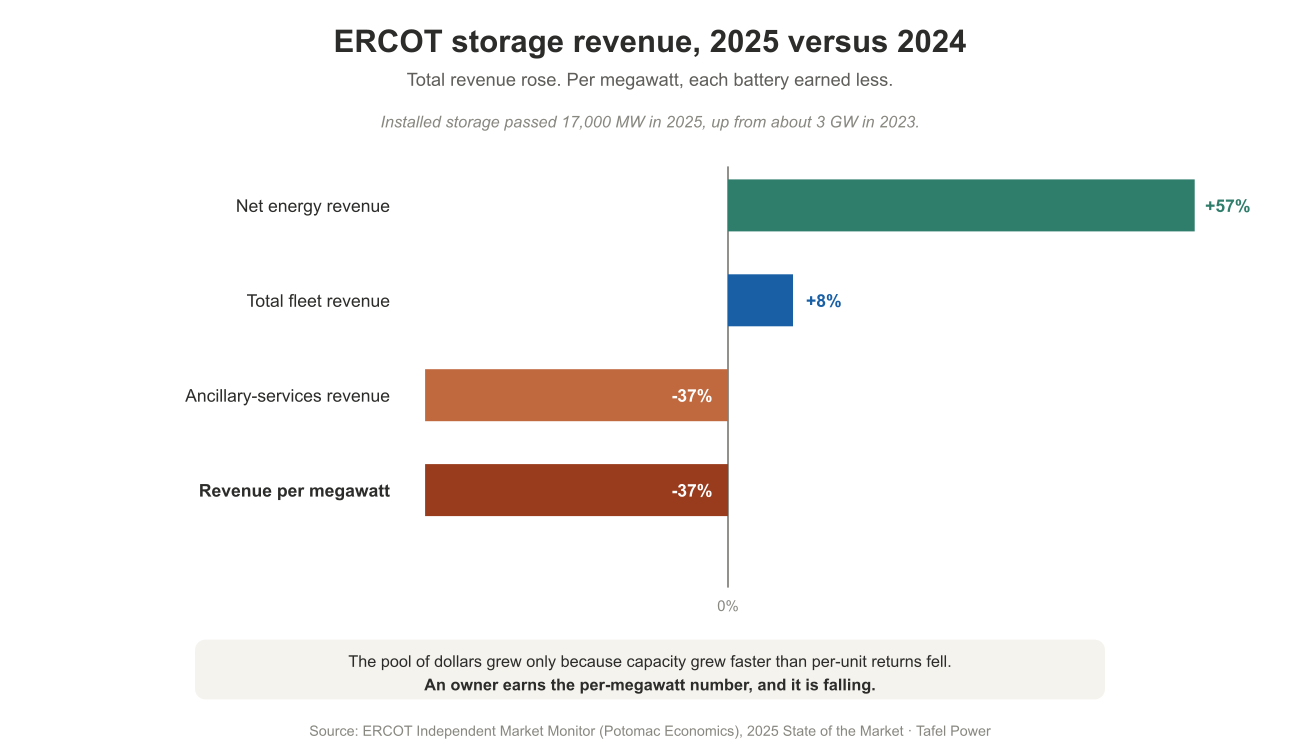
ERCOT battery revenue per megawatt fell almost 37 percent in 2025, while total fleet revenue rose about 8 percent. Installed storage passed 17,000 MW, so a growing pool of dollars was split across far more capacity. That is the trap.
What fell
Early ERCOT batteries earned mostly from ancillary services, the fast reserves a battery provides well. That was scarcity rent, and scarcity does not survive its own cure. Storage flooded the reserve markets and prices fell. ECRS, the reserve product created in 2023, fell from $76.77 per MWh in 2023 to $9.62 in 2024. The monitor ties that 2023 peak to artificial scarcity from its own deployment; more supply and milder summers then took it down. The two declines that follow share one mechanism but are not one measure: ancillary revenue fell more than 37 percent, and revenue per megawatt fell almost 37 percent.
Arbitrage replaced the rent. Net energy revenue rose 57 percent from 2024 to 2025 while arbitrage volume roughly tripled. That is more work for a thinner margin. Storage has even flattened the scarcity it trades. Price spikes occurred 40 percent less often in 2025 than in 2024, which the monitor credits to solar and storage growth, and to storage specifically during the solar ramps.
That rent was available to any battery, and the fleet competed it away. It is gone as a base case. So the question is no longer what the average battery earned. It is why a specific battery beats a falling average, and for how long. A durable, asset-specific reason to do that is an edge. None of them is permanent, and each kind erodes on its own clock.
Four edges, four clocks
Location. A congested node earns a wider spread. But a good node draws entry, and rivals compete it away unless the capacity behind it is closed. It also erodes on transmission. ERCOT endorsed more than $14 billion of it in 2025, up 271 percent, some aimed at the constraints that create today's spreads. Model a planned line as an erosion event, on schedule. Lines run late, and the slip is real upside, checkable against ERCOT's record. But delay is upside, not the edge. The edge is congestion that survives the build.
Interconnection. An operating point of interconnection, secured POI capacity, a substation position, and an energization date cannot be bought with newer equipment. They erode through transmission, contract limits, or the rights themselves, not through battery entry. This is strongest where the capacity behind the constraint is closed.
Configuration. Duration and power-to-energy ratio are real, but relative. They matter only against the future fleet, and the fleet keeps lengthening. The edge decays as rivals augment or enter cheaper. What lasts is the site and POI headroom that let you expand when others cannot, which is really an interconnection advantage.
Co-location. A battery paired with generation, load, a data center, or a behind-the-meter site earns on avoided cost, not the merchant curve. Its value is lower demand charges, firmer power, less curtailment, a faster connection. This is the strongest edge, and the reason is agency: the owner negotiates the erosion, through tariff, renewal, and the counterparty. It still depends on policy and the host load. It is influence, not control.
The green case lives here too. Storing solar to sell at night is arbitrage, and it erodes as more storage chases the same spread. It turns structural only when the pairing changes the counterfactual: capturing curtailed output, sharing a connection, stacking tax credits, or firming a clean contract to a premium. That premium rests on a policy clock, not the fleet's.
Notice what the four have in common. Each of them transfers with the asset. Sell the battery and the node, the interconnection, the configuration and the host relationship go with it. That is what makes them edges rather than good management.
What the market mistakes for alpha
Optimization, meaning the bidding algorithm. A better model is real, and it is the most copyable thing on the list. Vendors sell it, real-time co-optimization just narrowed it, and the gap between best and median closes as the fleet matures. Note how narrow that claim is. It is about software, not about running the asset.
Contracts. A toll does not create an earning reason. It moves the merchant risk to a counterparty, who prices it off the same forecast. And a toll does not erode. It ends. At year five or seven the asset is re-exposed to whatever market exists then, older and more degraded, a cliff rather than a slope. The cliff is what a toll hides when it stands in for a missing reason.
Early entry. First is an edge only if location, interconnection, or rights preserve it. Timing alone is not.
What could change this
Three things move underneath the framework, and each belongs in the underwrite.
Load growth runs the clock backward. ERCOT's load queue has passed 438 GW, nearly 90 percent of it data centers, and the monitor warns that as little as 20 GW of net new load could make the market structurally uncompetitive. The marketwide rent can recur if load arrives faster than firm supply, storage, and transmission. But queued load is not realized load, so renewed scarcity belongs in the upside case, not the base.
The market design moved. Real-time co-optimization went live in December 2025. The market now allocates a battery across energy and reserves at once, compressing the edge an operator used to earn by splitting them by hand. What remains is still replicable: forecasting, bidding, and state of charge. The residual reserve revenue has a policy clock too. The monitor finds ERCOT buys more reserves than reliability needs, including about 2 GW of no reliability value, and recommends cutting it.
The forecast itself is weakest where it matters most. Every serious valuation runs a market revenue forecast, a per-kilowatt-year stack from a third party. The near years lean on liquid power forwards. Past two or three years those thin out, and the rest is a fundamentals model carrying a precision it does not have. ERCOT just showed why to distrust it. The 2023 ECRS spike came from a reserve product introduced that year, deployed in a way that manufactured scarcity. No model had it, because it came from how a new product was run, not from market fundamentals.
So weight the early years, which hold most of the present value and most of the confidence. The far years hold little of either, and they need a reason, not a forecast extrapolation. The test is concrete: what share of value sits after the edge expires, and what is the residual assumption doing there? You can ask that in a data room. Whether the reason lasts fifteen years you cannot.
The dilution at the top of this piece is the same error one level up. A fleet total is not your asset's result, and a fleet forecast is not your asset's forecast. Node basis, duration, and degradation a forecast models at the project level, if generically. What it cannot price is what sits outside the model: interconnection rights and their timing, co-located avoided cost, and tariff and counterparty position. So the bridge has to be explicit. Asset revenue is the market forecast, adjusted for the asset-specific edge and how fast it erodes. A defensible relative advantage stays valuable even when the market level is misestimated. Avoided cost is underwritten from host economics, not merchant revenue, which is why co-location is the sturdiest edge here.
Who should build or buy
A forecast prices the fleet, not your asset. The mistake is paying an asset-specific premium on a fleet-average one, for an edge you have not named.
So build or buy where the edge is nameable and durable: a congested node behind closed interconnection, un-retrofittable site headroom, and above all co-location that changes a customer's counterfactual. The natural owner of that last one is the load itself, which underwrites the battery from host economics rather than merchant revenue.
Price still cures the rest. A battery bought at a basis that reflects fleet economics clears its hurdle. What it cannot do is justify a premium without a reason, an expiry date, and a value that survives past it.
The edge sets the ceiling
An edge sets what an asset could earn. What it does earn depends on the organization running it, and that is a separate variable almost nobody prices.
It is not a fifth edge, because it does not transfer. Sell the battery and the node, the interconnection, the configuration and the host relationship go with it. The operating team does not.
So the underwriting instruction is short. The edge you buy is priced into the deal. The fraction you capture is not. Availability, state of charge discipline against warranty cycle limits, augmentation timing and outage sequencing decide that fraction. Those sit in an organization rather than in software, which is why they copy slowly. The monitor does not publish the spread between the best and worst performing batteries, so the size of this gap is not reconciled here. It is not zero.
The management instruction is shorter. Name the edge in the investment memo. Assign it to the operator with a metric. Review it against its erosion clock once a year.
This matters most for buyers who are not storage companies. A hyperscaler or an industrial host acquiring co-located storage is buying the sturdiest edge on the list, and an operating business it may have no organization to run.
The discipline
Underwrite against the clock. Name the edge, name what erodes it and how fast, and measure how much value sits past its expiry. A market forecast describes the fleet. The bridge explains why this asset earns differently.
The pattern is not unique to ERCOT. Any market that adds storage faster than the scarcity it relieves competes away its own rent. What differs is the residual. In ERCOT it leans toward arbitrage, location, and episodic scarcity. A capacity market leaves a different one. The framework travels. The clocks do not.
Methodology
Figures are from the ERCOT Independent Market Monitor, Potomac Economics, in its 2024 and 2025 State of the Market reports, except the load queue. Installed storage passed 17,000 MW and 31,500 MWh at the end of 2025, up almost 80 percent from 2024, at 1.83 hours average duration. That is the monitor's installed-ESR basis, which runs above the commercially operational series some trackers use, so a figure nearer 14 GW is a narrower count. Revenue per megawatt fell almost 37 percent after normalizing for capacity, total net revenue rose about 8 percent, ancillary revenue fell more than 37 percent, and net energy revenue rose 57 percent with arbitrage volume roughly tripling. ECRS fell from $76.77 per MWh in 2023 to $9.62 in 2024, and price spikes fell 40 percent from 2024 to 2025. The 20 GW threshold for structural uncompetitiveness and the more than $14 billion of transmission ERCOT endorsed in 2025, up 271 percent from $3.78 billion in 2024, are the monitor's. The more than 438 GW load queue, nearly 90 percent data centers, is ERCOT's June 2026 figure. Real-time co-optimization went live December 5, 2025. These are fleet-level measures, not per-project results. The monitor does not publish the distribution of revenue across individual resources, so the spread between the best and worst performing batteries is not reconciled here, and assets vary widely by node, configuration, and contract.
All figures compiled by Tafel Power from public sources, informed by the firm's transaction advisory work in ERCOT and cross-ISO markets.
Questions, corrections or disagreement on any of this are welcome: kris@tafelpower.com
More from Insights
July 21, 2026
One Coordination Failure, on Two Clocks
The developer and buyer each need evidence created by the other's commitment, while grid rules adapt on a slower clock.
July 21, 2026
The Reciprocal Commitment Ladder: How Scarcity Determines Who Commits First
The right commitment structure is not universal. It depends on which side has alternatives, which inputs are scarce, and how much unrecoverable exposure each milestone creates.