Google, Microsoft, Amazon, Meta and Oracle Face the Same Carbon Problem. They Chose Five Different Answers.
Their targets differ, but what sits underneath them matters more. Each company built a different position, and each one carries a different cost, a different dependency and a different way of failing.
For hyperscalers · For infra funds · For developers · For utilities · firm-power · project-economics · policy · procurement · data-centers
Kris Narayanan · Tafel Power · August 17, 2026 · 20 min read
If you buy power, sell it, or underwrite either side, the target these companies publish is not the part that affects you. The instrument underneath it is. That sets the cost, constrains which supply is acceptable, and decides who takes the loss when the rules move.
Start with the targets anyway, because they look like the answer and are not.
| Company | Stated target | Date |
|---|---|---|
| 24/7 carbon-free energy | 2030 | |
| Microsoft | carbon negative | 2030 |
| Meta | net zero across the value chain | 2030 |
| Amazon | net-zero carbon | 2040 |
| Oracle | net zero, all scopes | 2050 |
The deadlines are twenty years apart, the scopes differ, and Microsoft's target runs the other way. None of that predicts what any of them bought.
Microsoft has the only carbon-negative target, and it is also the buyer most exposed to a removal market that has barely delivered anything. Meta has a 2030 net-zero target, reports 1,358 tonnes of emissions from the power it bought against 18.4 TWh of consumption, and sits behind an Entergy Louisiana plan with 2.3 GW of new gas approved and 5.2 GW more proposed. The target, the reported number and the steel going in the ground are three different stories about the same company.
You learn the position from the instrument, not the target. The instrument is the part with a price and a counterparty attached.
What each position depends on
This is the part worth putting in front of a credit committee, or in front of your own procurement team before the next renewal.
| Company | Primary instrument | What it protects | Where the exposure sits |
|---|---|---|---|
| Microsoft | durable removal and long-term clean power | a carbon claim that still holds decades out | whether the promised removals actually arrive |
| hourly matching and clean firm supply | a claim that matches the hours the power was used | assembling enough of it to match load hour by hour, at scale and at acceptable cost, plus capture economics nobody has priced | |
| Amazon | annual matching with attribute credits | a yearly clean-power claim | tightening of the rules on certificates |
| Meta | annual matching alongside new gas | speed to power | grid emissions rising as new gas is added |
| Oracle | renewable matching with a stated offset cap | a long runway and a cap on offsets | a 2050 promise against power decisions being made now |
Amazon's position rests on certificates at a moment when Scope 2 guidance is under revision, and Microsoft's own report describes the certificates it stopped buying as non-additional. Google's rests on assembling enough clean supply, storage and firm capacity to match its load hour by hour, at scale and at a cost it can accept. Meta's position needs three things to be true at the same time. Annual matching has to stay acceptable. The gas additions have to stay economically necessary. And the rising grid-emissions figure has to stay out of the way of the plan.
Three questions that work from either side of the contract
What instrument is the company actually using?
What rule, market or subsidy does that instrument depend on?
Who owns the cost when that dependency changes?
The first is in their report rather than their press release. The second is usually one sentence: certificates depend on acceptance, removal depends on contracted supply converting into delivered tonnes, capture depends on a credit with an end date. The third is a contract term, knowable at signing, and almost never disclosed publicly.
The rest of this brief is the evidence behind the five rows above: how the two reported numbers work, what each instrument costs, what each company bought, and what happened the one time a position like this was actually tested.
Each of them reports two different numbers for the same electricity
Every company here publishes two figures for the emissions of the power it bought, and they are not close to each other.
One counts what the company purchased. Sign a clean power contract and this number falls. That is the market-based figure, and it is the one companies quote. The other applies the average emissions rate of the local grid serving that load, and no contract changes it. That is the location-based figure.
Both are allowed under the same standard, which calls this category Scope 2, the emissions from purchased power. Neither measures what a single company's load physically caused.
The gap between the two is where every choice in this brief gets made.
| Load | Market-based | Location-based | Difference | |
|---|---|---|---|---|
| Google, 2025 | 43.6 TWh | 2.82 Mt | 15.15 Mt | 12.33 Mt |
| Microsoft, FY25 | 37.0 TWh | 2.71 Mt | 12.03 Mt | 9.32 Mt |
| Meta, 2024 | 18.4 TWh | 1,358 t | 5.97 Mt | 5.97 Mt |
| Oracle, FY25 | 5.1 TWh | 0.24 Mt | 1.60 Mt | 1.36 Mt |
Look at Meta's row. Annual matching takes the purchased figure to 1,358 tonnes against 18.4 TWh of consumption, while the average-emissions method puts 5.97 million tonnes on the same electricity. Both numbers are correctly reported. They differ by more than a factor of four thousand.
Amazon is missing from the table because it does not publish its electricity consumption. It reports 3.74 Mt on the purchased basis, but with no load figure an outside reader cannot work out the intensity behind it.
On the derivations: three of those loads are read off a stated consumption line. Oracle's is derived from its renewable electricity use of 4,645,576 MWh at 91 percent coverage, because its published total energy figure covers fuel as well as electricity.
What the six instruments do, and what they cost
There are six things a company can buy here, and they do three different jobs.
Change the reported number. Certificates and power purchase agreements lower the purchased-power figure. Be careful how far you push that. A new-build agreement can cause clean generation to exist that otherwise would not, and that is a real effect on the grid, not an accounting trick. What it cannot do is change the emissions of the electricity actually serving the load in the hour it is consumed. How the power is matched matters as much as how much is bought: annual matching and hour-by-hour matching are different products at different prices.
Change emissions at the generator. Gas with carbon capture is the only instrument here designed to cut emissions at the source while still producing firm electricity.
Sit outside the count altogether. Nature-based credits and durable removal do not reduce a company's own emissions at all. GHG Protocol says so directly: "GHG credits cannot be subtracted from the GHG inventory by the company retiring GHG credits."
Each one leans on something different. Certificates depend on continued acceptance under a Scope 2 standard now being revised. Power purchase agreements depend on additionality and on the grid they are delivered into. Gas with capture depends on qualifying for 45Q, on the capture rate holding, and on the economics after the twelve-year credit period ends. Removal depends on delivery.
Three of them are quoted per megawatt-hour already and can be read straight off the market. Gas with carbon capture belongs in the same group, but the one corporate contract we could find is private, so it has no public price at all. Every figure here is an incremental carbon-related cost on top of ordinary electricity supply, not a total power cost. The comparator throughout is ERCOT's 2025 day-ahead hub average of $33.50, which we calculate from the market's own settlement files.
| Instrument | $/MWh of load | What it changes |
|---|---|---|
| Unbundled certificates | 1.00 to 15.00 | the claim only |
| Illustrative solar PPA premium | 19.15 to 27.90 | claim and supply portfolio |
| Illustrative wind PPA premium | 27.69 to 50.29 | claim and supply portfolio |
| Gas with carbon capture | no disclosed price | emissions at the generator |
The other two are priced per tonne, so what they cost per megawatt-hour depends on how dirty the grid under that megawatt-hour is. That is a number you have to derive. Four of them disclose enough, so we did.
What it would cost, per megawatt-hour, to compensate each company's reported electricity footprint with the two tonne-priced instruments. Neither of them reduces those emissions, and this is not anyone's actual spend.
| Grid intensity, t CO2 per MWh | Nature-based credits, $ per MWh of load | Durable removal, $ per MWh of load | |
|---|---|---|---|
| 0.347 | 7.64 to 24.32 | 93.81 to 148.36 | |
| Microsoft | 0.325 | 7.15 to 22.76 | 87.79 to 138.84 |
| Meta | 0.324 | 7.13 to 22.67 | 87.45 to 138.30 |
| Oracle | 0.313 | 6.90 to 21.94 | 84.64 to 133.86 |
Look at how little the rows differ, and how much the columns do. All four sit on grids within 11 percent of each other, from 0.313 to 0.347 tonnes per megawatt-hour. These are companywide averages and individual sites will differ a great deal. But across a whole fleet, what separates these companies is not the carbon content of the electricity they buy.
Now read across instead. Covering the same megawatt-hour runs roughly $1 to $15 with an unbundled certificate, $19 to $50 with an illustrative PPA premium, and as much as $148 with first-of-a-kind durable removal. End to end that is a spread of about a hundred and fifty times, against a wholesale power price of $33.50.
So the instrument decides the cost, and the grid barely moves it. Which is the argument of this brief, arriving as arithmetic.
Those are rates. At annual scale they turn into budgets. Compensating Google's reported footprint with nature-based credits would run $333 million to $1.06 billion a year, and with first-of-a-kind removal $4.1 to $6.5 billion. Microsoft's equivalent is $3.2 to $5.1 billion, Meta's $1.6 to $2.5 billion, Oracle's $432 million to $683 million. Every one of those is a ceiling against that company's most recently reported year rather than anyone's actual spend, and the removal end assumes Frontier pricing that no portfolio buying at volume would pay. Hold the Microsoft number anyway, because the next section is about how much of a removal book that size has actually been delivered.
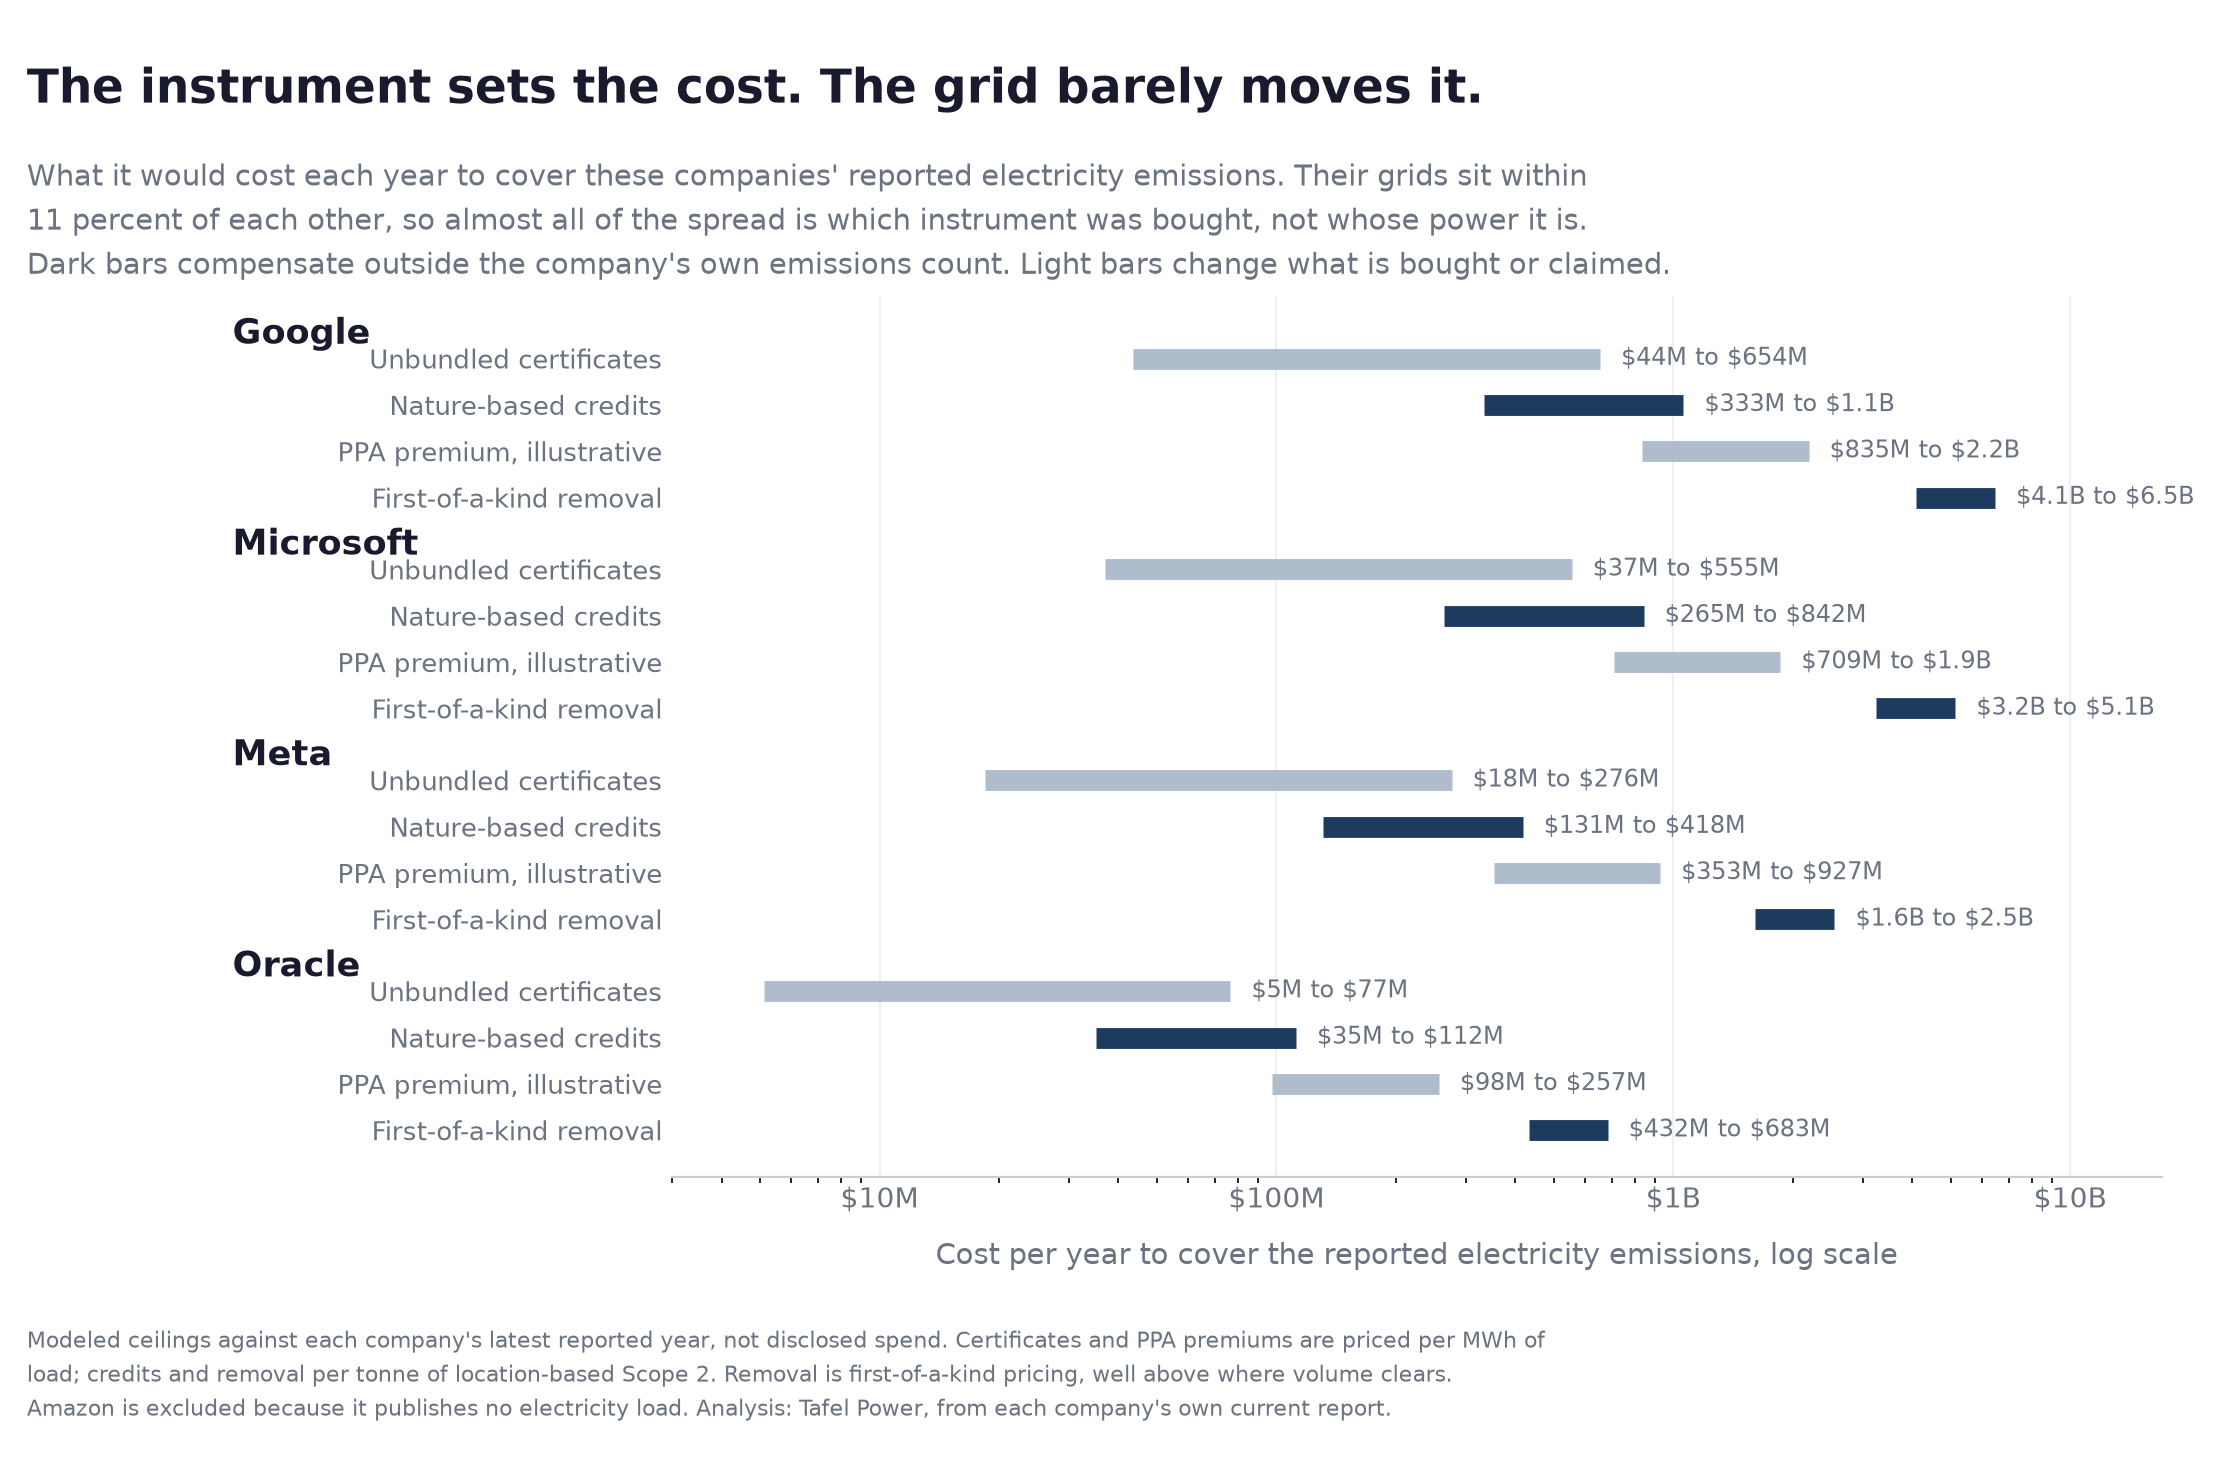
Two things about the table itself. Amazon is absent because it publishes no load figure, so its intensity cannot be derived. And a PPA premium is not purely a carbon cost: the same contract can carry energy value and hedge wholesale price, so it earns its keep in ways a certificate or a tonne of removal does not. It sits here as an incremental comparison, not as a like-for-like price on carbon.
These are not substitutes. A cheap certificate and an expensive tonne of removal do different jobs. The price tells you what one costs, not whether it is the one you need.
What each of them actually bought
Microsoft accepted a higher market-based Scope 2 number while shifting toward longer-term clean power and removals. It stopped using unbundled certificates bought on short-term terms, which its own report describes as non-additional. Its market-based Scope 2 went from 259,090 tonnes in FY24 to 2,707,428 in FY25. A tenfold rise, taken voluntarily. In FY25 it added 29 projects expected to contribute more than 45 million tonnes across all removal pathways over three decades.
Google is trying to move the electricity closer to the claim. It holds the 24/7 carbon-free goal and signed more than 12 GW of clean energy agreements in 2025, a figure that includes storage and certificate arrangements as well as generation. It also took an offtake from Broadwing Energy in Illinois, a gas plant built with carbon capture. Its methodology treats marketplace certificates as supplemental and secondary to those from its long-term agreements. The strategy pushes the supply itself closer to the claim, rather than leaning only on annual accounting.
Amazon publishes the strategy, but not the load figure you would need to check it. It reports 2025 emissions market-based, including Environmental Attribute Credits. Its portfolio runs to 42 GW across 375 utility-scale projects: 264 solar, 109 wind and two nuclear. Because it does not publish electricity consumption, an outside reader cannot derive the underlying intensity from its disclosures.
Meta is treating load growth and annual carbon matching as parallel tracks. It matches annually and retired 50,000 tonnes of removals against Scope 1 and 2. Entergy Louisiana's plan to serve its Richland Parish campus has 2.3 GW of combined-cycle capacity approved, with a further 5.2 GW proposed and still pending before the state commission. Those are utility resource approvals to serve the load, not gas offtakes Meta signed. The power arrives on the schedule the buildout needs, and the matching runs alongside it.
Oracle set the longest runway and capped what it will offset. Its net zero date is 2050, a decade behind Amazon and two behind the others, with an interim halving of Scope 1, 2 and 3 by 2030 against a 2020 baseline. Oracle states those targets have been approved by the Exponential Roadmap Initiative, a Race to Zero partner, so the 2050 date is a validated pathway rather than an absence of one. It defines net zero as cutting Scope 1, 2 and 3 by at least 90 percent and neutralizing the rest, which puts a stated ceiling of 10 percent on how much it will offset. Its Scope 3 capital goods line went from 1.29 million tonnes to 6.96 million in one year. Oracle also changed its Scope 3 method that year without restating the base, so growth and basis cannot be told apart from outside. That is a limit on what the report will tell you.
Two of the five ended up buying nearly the same thing. Amazon and Oracle both run annual matching with attribute credits. What separates them is a twenty-year gap in the deadline and Oracle's stated ceiling on offsets, which is a policy choice rather than a procurement one.
So five companies, between them using four of the six instruments, and none of the five is the correct answer.
What happened when the biggest position got tested
Microsoft is the largest buyer of durable carbon removal by a wide margin. On CDR.fyi's snapshot of April 13, 2026, it accounted for 36,439,157 of the 46,448,421 tonnes of durable removal ever contracted, or 78.5 percent. Frontier-linked buyers held 4.0 percent and everyone else held 17.5 percent.
Now look at delivery. Against 36.4 million tonnes contracted, CDR.fyi records about 91,000 tonnes delivered against Microsoft's disclosed portfolio, a quarter of one percent. It also records about 27 million tonnes of contracted bioenergy with carbon capture, with no credits from that pathway yet delivered under the disclosed agreements.
Part of that gap is schedule rather than shortfall. These are forward contracts running for decades, so an offtake signed in 2025 for deliveries starting in 2029 shows zero today by design. The difficulty for anyone underwriting the position is that the delivery schedules are not public, so from outside you cannot tell which part is timing and which part is not.
What you can see is the comparison. Buyers outside Microsoft and Frontier hold 17.5 percent of contracted tonnes and account for 90 percent of tonnes delivered and 94 percent of tonnes retired. The biggest portfolio has delivered the smallest share of what it contracted.
Then, in April 2026, Heatmap and Bloomberg reported that Microsoft had told suppliers it was pausing new removal purchases. Microsoft disputed the characterization, saying the program had not ended and that it adjusts pace and volume as part of a disciplined approach. On 20 May it signed a 650,000 tonne agreement with the Danish biogas producer BioCirc, delivering 100,000 credits a year from the second half of 2026.
A reported pause, disputed by Microsoft, followed by another purchase about six weeks later. That is what a dependency looks like when it is under load rather than in a risk register. Anyone underwriting a counterparty whose carbon position rests on removal now has an observed answer about how that position behaves when conditions change.
The tax code makes capture look cheap. Nobody will quote a price
45Q pays $85 a tonne for carbon captured and stored at a power plant. A combined cycle running at 7,239 Btu/kWh emits about 0.384 tonnes per MWh, and capturing 95 percent puts away 0.365 tonnes. The credit is worth $31.02 per MWh, against an ERCOT day-ahead average of $33.50. On paper the subsidy is close to the entire wholesale price of the electricity.
The market has not demonstrated that this makes capture cheap. We could identify one publicly announced US corporate offtake for a gas-fired plant with capture, which is Google's, and its terms are private. Internationally, Net Zero Teesside reached financial close in December 2024 on a government-selected cluster program and a government-backed contract for its output. The nearest cost comparator is NET Power's Project Permian. It roughly doubled its cost estimate, slipped three years, and was rescoped to a fraction of its original capacity.
So the missing price is carrying something. It could be construction risk, capture performance, storage and permitting, or CO2 liability. It could be the financing and tax-credit monetization needed to work around a credit that expires mid-contract. Which of those it is changes who fixes it.
Then there is year thirteen. The credit runs for twelve years from the day a qualifying project starts operating, while the plant and its power contract can run far longer. At year thirteen roughly $31 per MWh of value on today's parameters has to be replaced, absorbed or repriced by one of the parties to the contract. Broadwing has Google on the other side of the contract, and Teesside has UK government support behind it. In neither case is that allocation disclosed.
The decision
Targets are built to persist for years. The instruments underneath them can change much faster.
So before you sign, and before you rely on a counterparty who already has, find out three things. What did they actually buy. What does that purchase depend on. And who pays if that dependency moves. The third one is where the cost lands, and it is the part outsiders almost never get to see.
Do not underwrite the target. Underwrite the instrument.
Methodology and evidence grade
Company figures are from each company's own current report: Google's 2026 Environmental Report data tables, Microsoft's 2026 Environmental Data Fact Sheet, Amazon's 2025 Sustainability Report, Meta's 2025 Environmental Data Index and Oracle's FY25 Environmental and Social Impact Datasheet. Oracle's load of 5.1 TWh is derived from its stated renewable electricity use of 4,645,576 MWh at 91 percent coverage. Oracle does publish a total energy figure of 5,155,385 MWh for FY25, but that line covers energy associated with Scope 1 and 2 rather than electricity alone, so the derived number is the closer comparator to the other four, and Oracle reports limited third-party assurance across all scopes. Oracle's FY25 datasheet reports 91 percent renewable electricity coverage against a 100 percent goal while its website states it matched 100 percent of annual electricity use in 2025; Oracle moved from calendar to fiscal year reporting that year, so the two cover different periods and neither is wrong. Oracle also states it introduced new Scope 3 emission factors, categorization and categories in FY25 and did not adjust the base year. Google's 12 GW covers clean energy agreements including storage and certificate arrangements, not generation alone. Meta's figures are read from its 2025 Environmental Data Index: 18,423,634 MWh of electricity, market-based Scope 2 of 1,358 tonnes and location-based Scope 2 of 5,967,348 tonnes, all for 2024, which is its most recent published year. An earlier version of this brief derived that location-based figure by subtracting Meta's total market-based emissions from its total location-based emissions, which overstated it at 7.43 million tonnes. That gap spans more than Scope 2, because Meta also applies contractual instruments within Scope 3, so the subtraction does not isolate purchased power. The Entergy Louisiana figures are utility resource approvals to serve the Richland Parish load, with 2.3 GW approved and a further set of units totaling more than 5.2 GW proposed and still before the state commission. Microsoft's 45 million tonnes and CDR.fyi's 36.4 million are different scopes; they are reconciled below.
The power baseline is ERCOT's 2025 day-ahead hub average of $33.50 per MWh, our own calculation from ERCOT MIS report 13060, file DAMLZHBSPP_2025.zip, 131,400 rows across 8,760 hours and 15 settlement points. ERCOT's market monitor reports about $38 all-in on a real-time load-weighted basis for the same year, 13 percent higher, which is the difference between two definitions inside one market.
Two different carbon intensities appear in this brief and they are not interchangeable.
The per-company intensities in the cost table are each company's own reported figures, not a published grid factor: location-based Scope 2 divided by electricity consumed, from the same disclosures as the reporting table above. Google 15,148,700 tonnes over 43.6 TWh gives 0.347. Microsoft 12,030,556 over 37.0 TWh gives 0.325. Meta 5,967,348 over 18,423,634 MWh gives 0.324. Oracle 1,600,371 over a derived 5,105,029 MWh gives 0.313. These are weighted averages across each company's whole global fleet, so they blend clean and dirty grids and say nothing about any individual site. An earlier version of this brief converted tonne prices at a single ERCOT grid average of 0.33 tonnes per MWh, from EPA's eGRID with 2023 data. Using each company's own measured intensity is both more accurate and the point of the table, since the narrow spread between them is the finding.
The 0.384 tonnes per MWh used in the 45Q section is a different quantity: the output rate of one new combined-cycle plant at a 7,239 Btu/kWh heat rate. It is higher than any of the fleet averages because those already contain zero-carbon generation.
Both tables cover purchased electricity only. Generation a company owns and runs on its own site sits in Scope 1 and appears in neither column, so a dedicated turbine build would not show up here. For the four companies in the tables that is not currently hiding anything: Meta's Scope 1 for 2024 is 47,468 tonnes against a location-based Scope 2 of 5,967,348, under one percent of it, and Google, Microsoft and Oracle show the same pattern. Amazon is the exception, at 15.37 million tonnes of Scope 1 against 3.74 million of Scope 2, but that is dominated by delivery and aviation fuel rather than generation. The point matters more for the industry than for these tables, because operators putting turbines behind the meter would move emissions out of the purchased-power line entirely.
PPA figures are LevelTen's North American PPA Price Index for Q2 2026: 266 price offers from 185 projects across six ISOs, solar averaging $61.40 and wind $83.79, with best-quartile offers at $52.65 and $61.19. Those are offers into a marketplace rather than executed contracts. Subtracting a single-market wholesale benchmark from a six-ISO offer benchmark crosses geographies and ignores basis, curtailment, capture price, tenor and settlement structure, and compares a flat price to a shaped resource. Those rows are labeled illustrative for that reason.
Durable removal prices are Frontier's published purchases: $31.3M for 115,211 tonnes from Planetary, stated by the parties as $270 a tonne, and $41M for 96,000 tonnes from Reverion, which divides to $427. Frontier buys ahead of the market on purpose, to pull first-of-a-kind pathways into existence, and its prices cover measurement and verification as well as the tonne, so they do not represent removal bought at volume. A portfolio weighted toward bioenergy with capture and afforestation would never price at those rates.
Two Microsoft figures in this brief have different scopes and should not be netted against each other. The 45 million tonnes is from Microsoft's own 2026 report, which states that the 29 projects added in FY25 are expected to contribute more than 45 million tonnes over three decades, across all removal pathways including nature-based. The 36.4 million tonnes is CDR.fyi's count of Microsoft's cumulative contracted volume in durable removal only, meaning permanence measured in hundreds to thousands of years. One is a single year across all pathways, the other is cumulative within a narrower definition, which is why they can both be right. Concentration and delivery figures are from CDR.fyi's April 13, 2026 demand structure snapshot, which counts disclosed and self-reported transactions only, so undisclosed volume is missing by construction. Of the roughly 91,000 tonnes delivered, about 75,000 was biochar, 12,000 marine biomass capture and 2,000 biomass geological sequestration.
The pause was reported by Heatmap on 10 April 2026 and by Bloomberg the following day, sourced to unnamed staff and suppliers rather than to a filing. Microsoft's response and the BioCirc agreement of 20 May 2026 are on the record, and that interval is the six weeks described in the text. Nothing in the argument depends on the pause having been permanent, which it was not.
Nature-based credit prices are market intelligence rather than filings, roughly $22 a tonne as a 2026 average for afforestation and reforestation, with premium corporate deals reported up to $70. Certificate prices are a quoted range for voluntary wind. Those two are the weakest inputs here.
The accounting rule is quoted from GHG Protocol's Land Sector and Removals Guidance, which requires retired credits to be reported separately from inventory emissions and removals and states that credits cannot be subtracted from the inventory by the company retiring them. That guidance is written for the land sector, and the same separation principle runs through the Corporate Standard, but a reader relying on this for engineered removals specifically should check the instrument that governs their case. Scope 2 guidance is currently under revision, so the treatment of contractual claims may change.
The 45Q figure is statute applied to plant parameters, using a heat rate from EIA's Assumptions to the Annual Energy Outlook 2026 and the EPA's Table C-1 factor of 53.06 kg CO2 per MMBtu. It is arithmetic about the tax code rather than an observed cost, and it understates for a plant reaching commercial operation after 2026 because 45Q indexes to inflation. The twelve-year credit period runs from the date a qualifying project is placed in service, so the year-thirteen point is about that period ending rather than about the statute expiring. Project facts on capture are from company announcements and trade coverage rather than filings, except NET Power's MISO withdrawal, reported in an 8-K, and its rescoping, from its fourth quarter 2025 investor materials. NET Power runs an oxy-combustion cycle rather than post-combustion capture on a combined cycle, so it is a comparator for the class of bet rather than for the plant discussed here. Our search for corporate offtakes covered public announcements and trade press, so read it as the only one we could identify rather than as a complete census.
Nothing here alleges misreporting. Both Scope 2 methods are standard and every company named discloses its choice.
This is analysis of public disclosures, not investment advice. All analysis by Tafel Power from public sources.
Questions, corrections or disagreement on any of this are welcome: kris@tafelpower.com
More from Insights
August 16, 2026
Who Holds the Fuel Risk?
Gas moved by $39 to $59 a megawatt-hour over three years. Where that lands is a drafting choice, not a market fact.
August 16, 2026
Fifty Percent of What?
Every large-load power deal sets a minimum the customer owes whether or not it draws. Everyone compares the percentage. What the percentage is a percentage of is what decides whether it protects anyone.