Where Does the Money From a Data Center Power Plant Go?
We modeled a 1,000 MW gas plant built to power a data center. Lenders and investors collect about seven times what the companies that build it earn, for putting up the money.
For hyperscalers · For infra funds · For developers · For utilities · supply-chain · procurement · firm-power · project-economics · capital
Kris Narayanan · Tafel Power · October 10, 2026 · 14 min read
One gigawatt, priced from the bottom up
This prices a behind-the-meter gas plant built for one data center, not a grid-supplied data center, and only the plant. The chips, servers, cooling and the data center building are not in it, and neither is any grid interconnection or backup arrangement, the pipeline or the land.
The base case is a 1,000 MW combined cycle gas plant in West Texas, running at 90 percent on a twenty year contract to a data center. It costs $2,000 per kW to build, or $2 billion, in line with recent utility filings (see Methodology). It is funded with 60 percent debt at 7 percent and 40 percent equity looking for 12 percent, and pays tax at 21 percent.
Spread over its output, the plant needs about $43 per MWh to cover its costs and pay back its funders. That is a revenue requirement, not a contract price. The fully delivered cost of firm power would be higher once any grid interconnection or backup arrangement, firm gas transport, water, spare units, interest during construction, property tax and insurance are included; Methodology lists the rest. How a contract prices it depends on its structure; real deals usually split it into a capacity payment, a fuel charge and a start charge, as How a Data Center Gas Plant Gets Paid shows. At $1,200 per kW the same plant needs about $31 per MWh. The answers below hold at both.
A data center that needs 1 GW of firm power can need more than 1 GW of plant. A single 1,000 MW plant cannot guarantee uninterrupted supply to a 1,000 MW data center that runs all the time. Planned maintenance, forced outages and operating limits mean firm supply needs spare units, a grid backup or storage. Stateline in Mississippi is permitted for 1,240 MW against a contract of about 900 MW, according to its Mississippi air permit (PSD 0680-00119) and Solaris Energy Infrastructure's offering memorandum (Form 8-K Exhibit 99.1, 22 September 2026). The permit does not say how much of the difference is spare units. Extra capacity raises the cost of supplying firm power. The breakdown below applies only to the modeled 1,000 MW plant.
Who gets what, and how much of it is profit
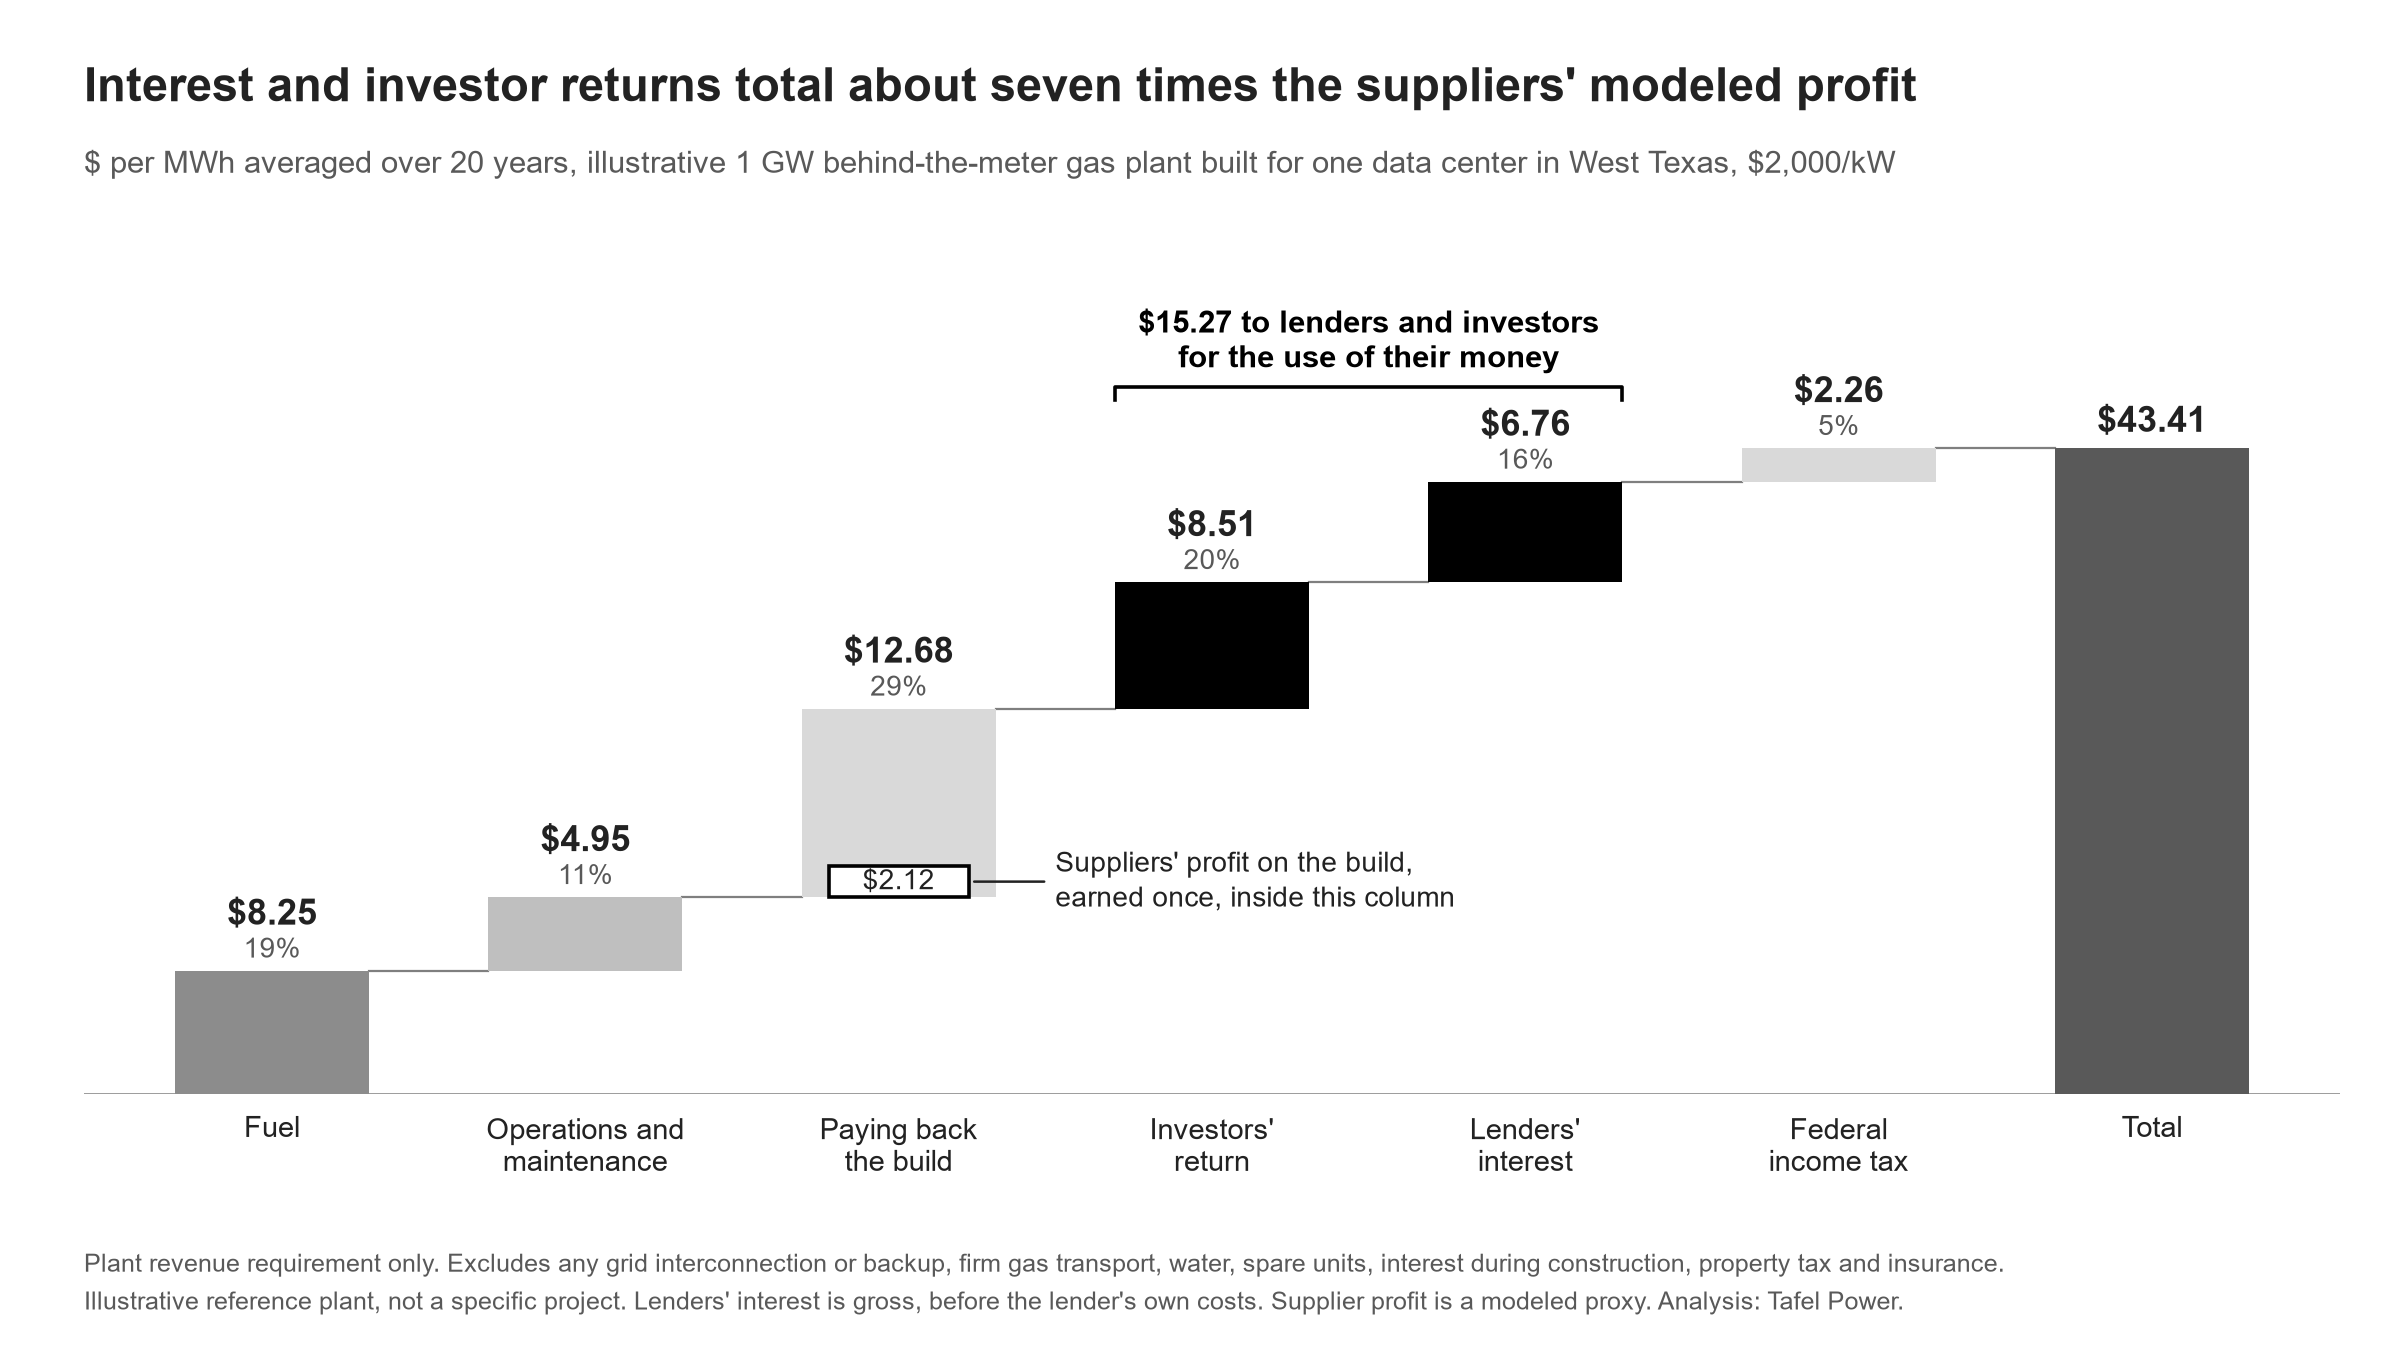
The $43 is split six ways, and only part of what each group receives is profit. The suppliers' profit is not a seventh slice. It sits inside the build cost.
| Who | Gets per MWh | When | Is it profit? |
|---|---|---|---|
| Gas seller | $8.25 | Every MWh, 20 years | Gross fuel revenue. What the seller keeps depends on what the gas cost it. |
| Operators and service contractors | $4.95 | 20 years | Revenue. Includes the turbine maker's service agreement; the margin inside is not disclosed. |
| Paying back the build | $12.68 | 20 years | Not profit. It returns the $2 billion. |
| of which, suppliers: turbine, electrical, EPC | $2.12 | Once, during construction | Profit, modeled. |
| Investors | $8.51 | 20 years | Close to profit: the 12 percent return they target. |
| Lenders | $6.76 | 20 years, falling as the loan is paid down | Gross interest. The lender's profit is the spread over its own funding cost. |
| Government | $2.26 | 20 years | Federal income tax on the plant's profit, at 21 percent. |
The finding: lenders and investors are paid the most for providing the money, while the suppliers earn their margins up front and use their capital again on the next project. Neither figure on its own says who earns the best return on capital.
Lenders and investors collect the most, for putting up the money
Lenders and investors collect $15.27 per MWh for the use of their money, averaged over 20 years. That is about $1.34 billion to the investors and $1.07 billion to the lenders, about seven times the suppliers' $2.12. It is also 35 percent of the price, nearly twice the plant's fuel.
The rates behind it are assumptions, within the range of deals we have looked at. Blended, the 7 percent loan and the 12 percent return come to about 9 percent on the whole plant. In two deals our earlier work examined, an investor buying a long-contracted plant accepted about 6.6 percent and a developer building on a short contract priced for about 15. That is a range from two transactions, not a market benchmark. The investors commit about $800 million of equity up front and stay exposed to construction, operating and contract risk across the twenty years.
Two qualifiers keep the seven times honest. The lenders' $6.76 is gross interest, and what a project lender keeps after its own funding cost and losses is not public. On the cleanest comparison, the investors' $8.51 against the suppliers' $2.12, the gap is about four times, or about 2.3 times once both are discounted at 8 percent, a rate between the two sides' cost of money.
Who the investor is matters. It may be a developer, an independent power producer or an infrastructure fund. If a hyperscaler funds the plant itself, the $8.51 is no one's profit. It is the hyperscaler's own cost of capital.
A more expensive plant enlarges this pool more than the suppliers'.
| Build cost | Paid to lenders and investors, 20 years | All supplier profit, once |
|---|---|---|
| $1,200/kW | $1,444M | $200M |
| $1,600/kW | $1,926M | $267M |
| $2,000/kW | $2,407M | $334M |
| $2,400/kW | $2,889M | $400M |
Equipment inflation is often described as a supplier windfall. On this arithmetic it mostly enlarges what is owed to lenders and investors. Their percentage return does not rise with the build cost, and a more expensive plant may simply be a worse project.
Gas is the line that moves most, and revenue is not profit
Fuel is $8.25 per MWh at 2025 West Texas prices, about a fifth of the price. At $3.50 gas it becomes $25 of a $60 price, the largest single line. Lenders and investors take 35 percent of the revenue at $1.15 gas and 25 percent at $3.50.
Build the same plant away from West Texas and the gas seller takes more. Henry Hub averaged about $3.59 over the twelve months to September 2026, on EIA's monthly spot prices. At that price fuel is about $26 of a $61 price, 42 percent and the largest single line. A plant elsewhere pays the price at its own hub plus transport, so this is a benchmark rather than a delivered cost. Lenders and investors still collect the same $15.27, because their share depends on what the plant costs to build, not on gas.
The $8.25 is gross fuel revenue, and what the seller keeps depends on what the gas cost it. The plant buys at the Waha hub, usually from a marketer or a pipeline, not at the wellhead. Much Permian gas is produced alongside oil, and the hub price is low because the pipelines are full. A producer still pays for gathering, processing and transport before its gas reaches the hub, and at 2025 prices some producers net little or nothing. Public data does not show how the $8.25 splits between producers, marketers and pipelines.
The suppliers get the smallest share, paid up front
Split the $2 billion the way a plant like this is bought, and apply each supplier's own margin to its slice. We use roughly 35 percent for the turbine island, 25 percent for electrical equipment and the rest of the plant, 28 percent for construction labor, and 12 percent for the owner's costs and contingency.
- Turbine maker, about $132 million, at GE Vernova's 18.8 percent Power segment EBITDA margin
- Electrical equipment makers, about $138 million, at Eaton's 27.5 percent Electrical Americas operating margin
- EPC contractor, about $64 million, at Quanta's 11.5 percent Electric segment operating margin
That is about $334 million, paid once, or $2.12 per MWh over the plant's output. It is not a cost on top of the $43. It sits inside the $2 billion build cost, so it is recovered within the $12.68 that pays back the build.
The suppliers receive less from any one plant but are paid up front, and can use their capital again across many projects. They have far less money tied up than the investors, though not none: warranties, performance guarantees and retained payments keep part of a contract at risk for years after the plant starts, and a service agreement carries availability guarantees for its life. That can make for attractive returns on the suppliers' own capital. This brief does not calculate those returns, so it does not rank them against the investors'.
This is a modeled figure, not what any supplier earned on a real plant. The split is our own working estimate, and the margins are whole-segment figures for businesses that serve many markets. If every dollar of the $2 billion earned 27.5 percent, the highest margin in the set, supplier profit would be $3.49 per MWh, and lenders' and investors' $15.27 would still be about four times that. The margins are also before tax, while the investors' $8.51 is after it. After tax, the $2.12 is closer to $1.67.
The suppliers' ongoing money is in service. EIA's operating costs for this plant include the fixed payment on a long-term service agreement for the turbines and major maintenance that scales with running hours, so part of the $4.95 goes back to the turbine maker every year. The margin on it is not disclosed.
Developers are a separate pool this model cannot size
A developer building on a short contract wants about 15 percent on the whole plant, before any borrowing. That is the return on Williams' first Ohio project at its stated 5x build multiple on a 10-year contract, as How a Data Center Gas Plant Gets Paid works through. An investor buying a long-contracted plant accepts about 6.6 percent, on our arithmetic for TransAlta's Colorado acquisition. This model sits in between at about 9 percent.
That gap points to where development profit can come from, but it does not measure it. A developer can earn through development fees, a sale of the finished plant, a retained ownership stake or contract terms. Sizing any of those takes the price, timing and terms of the deal, plus the construction risk the developer carried, and public data does not show them. So development is a separate pool, not part of the $15.27 or the $2.12, though a development fee can sit inside the owner's costs that the build cost repays.
What this changes for anyone pricing a plant
For a buyer, what the plant costs to build moves the price more than what the money costs. Raising the loan rate from 7 to 9 percent adds $2.31 per MWh. Raising the investors' return from 12 to 15 percent adds $3.32. Raising the build cost from $2,000 to $2,400 per kW adds $6.04. Gas moves the price most of all, $16.87 from $1.15 to $3.50, but the market sets that.
For an investor, the most cash is not the same as the best return. Lenders and investors collect the most because they put up the most money for the longest time. A supplier's margin describes that supplier, not where a plant's money goes.
For a supplier, the money that comes back every year is in service. A long-term service agreement turns a one-time sale into a recurring claim, which is why the equipment makers want them.
Methodology
This is an illustrative reference plant, not a model of any specific project. It shows order of magnitude and ranking and should not be read to the decimal. Per MWh figures are averaged across twenty years of output, not levelized in the project finance sense, and are undiscounted unless stated. Every figure comes from one model built by Tafel Power.
The plant. 1,000 MW combined cycle, 90 percent capacity factor, twenty years, producing 7.884 million MWh a year.
Build cost, $2,000 per kW, plant only. It excludes interconnection, transmission and any behind-the-meter delivery scope, which can be a large share of the cost for a data center site. EIA's AEO2025 capital cost study puts a new combined cycle at $868 to $921 per kW in 2023 dollars, turnkey and excluding financing. On EIA's $868 per kW and its 6,266 Btu per kWh design heat rate, the same model gives $25.27 per MWh, which mixes 2023 dollars with 2025 gas and should be read as a floor. The study predates the current equipment market. On its first-quarter 2026 earnings call on April 22, 2026, GE Vernova said it expected its orders in the first half of 2026 "to be priced 10 to 20 points higher than our 4Q'25 orders on a dollar per kW basis." The base case uses $2,000. Entergy's second quarter 2026 10-Q puts "seven new combined cycle combustion turbine generation resources totaling 5,278 MW at a total cost of approximately $12.9 billion," about $2,440 per kW; the same sentence also lists three battery projects, so the total may cover more than the gas units. Two applications to the Public Service Commission of Wisconsin (documents 568288 and 568295) describe simple-cycle combustion turbine plants, Foundry Ridge at 270 MW for about $564.2 million, or $2,089 per kW, and Red Oak Ridge at 1,125 MW for about $1.770 billion, about $1,570 per kW of nameplate capacity. EIA's study prices a simple-cycle frame plant at about $836 per kW and combined cycle at about $868, so the filings sit about twice EIA's 2023 figures. The Wisconsin units are smaller E-class turbines, which cost more per kW than EIA's H-class reference. We run the answer from $1,200 to $2,400.
Fuel, $8.25 per MWh. A heat rate of 7,176 Btu per kWh, computed by us from the realized 2025 performance of the US gas combined cycle fleet in EIA-923, times a 2025 Waha spot price of about $1.15 per MMBtu, its 2025 average in commercial daily index data. We have not reconciled that figure to a primary filing. It is held flat for twenty years to isolate the split, not as a forecast, and a real plant would also pay for firm pipeline capacity and hedging. The gas sensitivity runs to $2.50 and $3.50.
Operations, $4.95 per MWh. EIA's reference plant figures of $12.12 per kW-year fixed and $3.41 per MWh variable. EIA states that these exclude property taxes and insurance, and that firm gas transportation is not included. All three would raise the price and leave the split between the money and the suppliers unchanged.
Financing. 60 percent debt at 7 percent, paid down over twenty years, and 40 percent equity targeting 12 percent. Paying back the build is shown separately from interest and the investors' return, because repayment is not earnings. The 12 percent is an input, so the model assumes the investors' return rather than demonstrating it. The investors' return is spread evenly across the twenty years in the chart and the per MWh figures. The present value comparison uses the declining schedule a 12 percent target implies; spread evenly instead, it is 2.0 times rather than 2.3.
Life and residual value. The contract and the model run twenty years with nothing left at the end. EIA assumes a 40-year operating life for this plant type, so the plant would still be worth something. That favors the money slightly, but not by much: a plant worth a quarter of its build cost at year twenty, discounted at the investors' 12 percent, would lower the price by about $1.11 per MWh.
What the $43 leaves out. Each item below raises the price and leaves the split between lenders and investors and the suppliers about where it is, because most of them scale with the build cost or sit outside both.
- Before the plant runs. The model spends the $2 billion at once. A real plant draws it over two to three years and capitalizes the interest. If all spending carries the 7 percent loan rate, that adds about 7 to 11 percent to the build cost, or about $2 to $3 per MWh, on our model. Land, site work, water rights, permits, and turbine reservation deposits paid before the investment decision are also excluded.
- Fuel. The gas lateral to the site and firm pipeline capacity to the plant gate, hedging or a fuel-risk premium, and backup fuel such as on-site diesel with dual-fuel turbines. Who carries the fuel risk is set by the contract, as Who Holds the Fuel Risk? shows.
- Running the plant. Water supply and treatment, or the cost and efficiency loss of dry cooling where water is scarce; emissions controls beyond the base plant; spare parts and working capital; and heat-rate degradation, since the model holds 7,176 Btu per kWh flat for twenty years.
- Financing, credit and end of life. Loan fees and debt reserve accounts; letters of credit, collateral and damages exposure under the contract, which cost money every year; and decommissioning, which is small once discounted.
Tax. 21 percent federal, straight-line depreciation over twenty years, interest deductible. State tax, accelerated depreciation, tax credits and interest limits are excluded. Texas has no income tax but does levy a franchise tax on margin, which this model leaves out. Many owners pay less current federal tax than this: accelerated depreciation defers it, pass-through owners pay it at their own rates, and public power owners pay none. So the $2.26 is an upper estimate.
The supplier split, the weakest input here. The 35, 25, 28 and 12 percent shares are working proportions for a plant of this type, not a component estimate from a real project, and they are not sourced. Each supplier's profit is its own segment margin for the quarter to June 2026 applied to its slice: GE Vernova's Power segment EBITDA margin of 18.8 percent, Eaton's Electrical Americas operating margin of 27.5 percent and Quanta's Electric segment operating margin of 11.5 percent. One is EBITDA and two are operating margins, a difference the earlier brief takes apart, and adding them overstates the total slightly. GE Vernova's margin includes service, and we apply it only to the initial equipment. The 27.5 percent stress case is a test at the highest margin in this set, not a limit on what any supplier could earn.
The ratio holds only so far. The seven times between the payment for money and supplier profit is the same in every build cost and gas price case, because both scale with build cost. That is arithmetic, not evidence that the finding is robust. It does move with the financing: about 6 times with a 5 percent loan or a 10 percent equity return, and about 8 to 8.5 times with a 9 percent loan or a 15 percent equity return.
All analysis by Tafel Power from public sources.
Questions, corrections or disagreement on any of this are welcome: kris@tafelpower.com
More from Insights
October 3, 2026
The Plant That Outlives the Bridge
A data center that pays enough during the bridge years can repay its gas plant before the grid arrives. Then the later years can become largely upside. If it does not, they are a bill. The disclosed contracts rarely say who gets which.
September 25, 2026
How a Data Center Gas Plant Gets Paid
A gas plant built for a data center outlasts its contract by decades. What the money needs sets most of the price: a developer on a 10-year contract needs about 20 percent of build cost back a year, a long-term investor about 8 percent.