Half a Gas Plant's Earnings Came on 1 Percent of Its Days
Fifteen years of Texas power prices show that the days that create most of a gas plant's value are the days it is hardest to deliver.
For hyperscalers · For developers · For utilities · For infra funds · valuation · gas · ercot · scarcity · reliability · contracts · liquidity · data-centers
Kris Narayanan · Tafel Power · October 28, 2026 · 10 min read
Where the earnings came from
In this first pass the plant never breaks down; outages come in the next section.
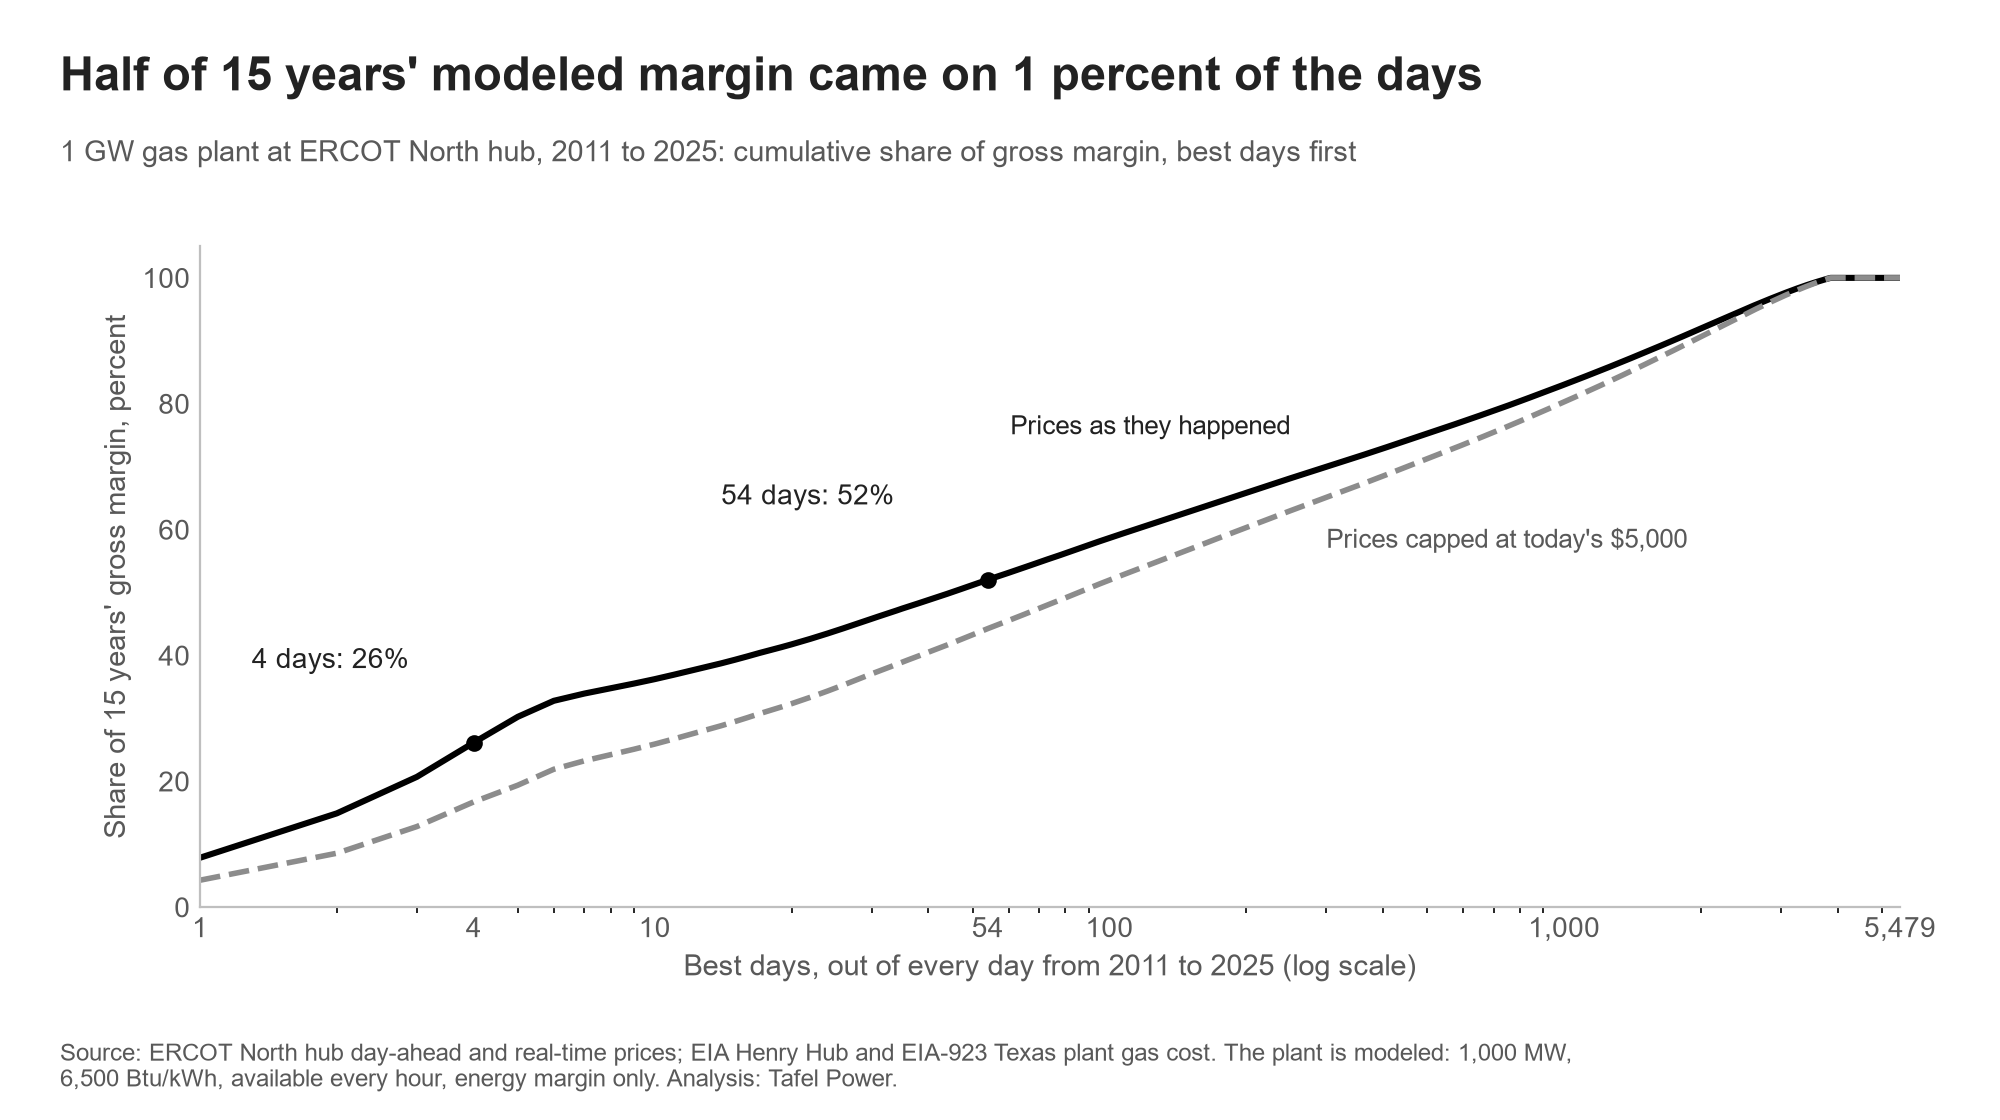
| Best days, of 5,479 | Share of 15 years' margin | With prices capped at $5,000 |
|---|---|---|
| 4 | 26% | 17% |
| 20 | 42% | not shown |
| 54 (1 percent) | 52% | 44% |
| 273 (5 percent) | 69% | not shown |
The best day, 17 February 2021, earned $174 million. The median day earned about $104,000. On 1,607 days, 29 percent of them, the plant stayed off: on all but 62 of those days power paid more than running cost in some hours, but not by enough to cover the $50,000 cost of starting the plant. Of the top 54 days, 38 fall in five months: August 2023, August 2011, August 2019, February 2021 and July 2018. Christmas Eve 2022, in Winter Storm Elliott, is one more. Houston, West and South hubs give the same answer, 49 to 52 percent on the best 1 percent of days. A less efficient plant is more concentrated, not less, because it loses ordinary-day margin first: at the fleet's 2025 average efficiency the best 1 percent of days earn 55 percent.
Texas regulators cut ERCOT's offer cap from $9,000 to $5,000 per MWh after Uri. With every price capped at $5,000, the four Uri days fall to 17 percent of the total, and the best 1 percent of days still earn 44 percent. The concentration partly comes from how ERCOT pays for scarcity, so the cap is also a test of that design. In PJM and MISO part of this value is paid as capacity, which changes who pays for these days, not whether the plant has to run on them.
These are energy earnings only. Reserve prices peak on the same days: from 2015 to 2025 the best 1 percent of days carried 68 percent of the highest reserve price, against 56 percent of this plant's energy margin. Without 2021 the shares were 25 and 31 percent. So reserve revenue would not spread the earnings out much: with a Uri in the years it would raise the share, and without one it would lower it a little.
The plant has to be running on those days
Conventional plants are forced out about 7.7 percent of the time on average, and the same cold that raises prices freezes equipment and cuts gas supply. In Uri, ERCOT averaged 34,000 MW of generation out for two days, and frozen equipment and gas supply problems caused three quarters of the outages in the region. We ran 1,000 fifteen-year histories of forced outages over the same prices.
| Outages | Margin, $ per kW a year | Margin lost | Share of the loss on the best 54 days | Histories averaging at least $140 (the $1,600 per kW requirement) |
|---|---|---|---|---|
| None | 147 | none | none | all |
| At random, 7.7 percent of the time | 136 | 8% | 54% | 35% |
| Stress assumption: three times as likely when real-time power is above $1,000 | 130 | 12% | 68% | 21% |
| Stress assumption, and out for Uri in half the histories | 114 | 23% | 83% | 10% |
Even random outages take more than half their toll on the best 54 days, because that is where the margin is. The random row uses the measured rate. The three times is our stress assumption, not a measured relationship: Uri shows that outages and scarcity arrive together, but no published rate says by how much. The last two rows are stress scenarios, not expected losses.
What a new plant has to believe
A plant has to earn back what it cost. Divide the build cost by the multiple an investor pays for a year of earnings and add fixed running costs, and the result is the gross margin the plant needs each year. These are illustrative comparisons using capital multiples, not a discounted cash flow valuation or a financing hurdle. A plant on a long contract earns its contract, not these days, so the test is whether fifteen years of the market would have justified the price a long-contract buyer pays for a plant. The multiples come from How a Data Center Gas Plant Gets Paid and the filings in Data Center Gas Plants: The Record.
| Build cost | Needed a year, long contract (12.5x) | Years it was earned, 2011 to 2025 |
|---|---|---|
| $868 per kW (EIA, 2023 dollars) | $82 per kW | 7 of 15 |
| $1,600 per kW (Entergy Mississippi, 2024 and 2025) | $140 per kW | 4 or 5 of 15 |
| $2,100 per kW (Entergy Texas and Arkansas, 2025) | $180 per kW | 2 or 3 of 15 |
Over the fifteen years the always-available plant averaged $147 per kW a year, and $101 without 2021. At $1,600 per kW, the market history met the $140 requirement only with the plant running through Uri. With prices capped at $5,000, the average is $127, Uri included. With outages it averaged $136 at random and $114 in the stress case with a Uri outage. Houston, where the plant earned more, gives $145 and $123, and meets $140 in 85 and 32 percent of histories. At 5x, a shorter contract or a merchant return, even EIA's $868 per kW needs $186 a year.
None of this says a plant cannot be financed. Contracts, reserve revenue and a cheaper cost of capital all change the answer. It says what the market history alone would have supported.
Recent filings run higher. The $1,600 row is what Entergy Mississippi disclosed for two 754 MW plants in 2024 and 2025, $1.2 billion each. Entergy Texas's approved cost cap for its Legend plant and Entergy Arkansas's estimate for its Jefferson plant come to about $2,100 per kW, and Evergy's two Kansas plants to about $2,200 to $2,250 before financing costs. Two Louisiana plants filed in February 2026 come to about $2,700 per kW, which would need about $230 a year.
What the plant has to believe is not an average price. It is that scarcity days will come, and that the plant will be running when they do.
The same days test the rest of the deal
The other protections around a plant are also measured on averages and tested on the same few days.
| What is relied on | How it is usually measured | What happened on the days that mattered |
|---|---|---|
| The plant runs | Forced outages about 7.7 percent of the time | In Uri, ERCOT averaged 34,000 MW of generation out for two days |
| A firm contract | A fixed price per MWh | At 2021 prices, four days cost a 600 MW contract more than a year of its payments |
| The seller can pay | A credit rating | An A-rated cooperative faced invoices due within days and filed for bankruptcy |
In our model, with the plant out from 15 to 18 February 2021 and 600 MW sold for the daytime hours at about $66 per MWh, replacing the power cost about $295 million more than the contract paid, against $232 million of payments a year ($189 million against $212 million under today's cap). A firm contract leaves that cost with the seller. A toll or unit-contingent contract moves it to the buyer. Where it lands is a drafting choice, like the one Who Holds the Fuel Risk? sets out for gas prices.
Whoever holds it pays within days. Brazos Electric Power Cooperative had an "A" to "A+" credit rating before the storm. ERCOT invoiced it about $1.9 billion, with payment "required within days", and it filed for Chapter 11 on 1 March 2021 to protect its members, in its words, "from unaffordable electric bills". Vistra, which had reported more than $1.5 billion of cash and credit available, put the net impact at about $1.6 billion two months later.
Monthly prices worked well, until recently
Valuing the plant on the exact average peak and off-peak price of each month, known in advance, recovers 92 percent of what it earned from 2011 to 2025, because a storm month's average carries the storm. So a good monthly view captures most of the value. What it cannot do over twenty years is say which month holds the storm.
The change is recent. A perfect monthly average recovered 95 percent or more in seven of the nine years to 2019, then 78 percent in 2024 and 65 percent in 2025. More of the value now sits in the shape of prices within the day, the value batteries compete for. The battery market's own shift is in ERCOT Fleet Revenue Rose 8 Percent. Revenue per Megawatt Fell 37 Percent.
What this means
- In this model, half of a Texas gas plant's merchant energy margin sits on about 1 percent of its days, and the share holds under today's price cap. Capacity payments, reserves and contracts can spread revenue differently.
- A plant is worth what it can reliably capture on those days. Outages cost more than their rate suggests, because they fall where the money is.
- The contract and the seller's cash are tested on the same days, and each is usually judged on its average.
- How reliably the plant runs, what it is worth and what the contract says are usually decided separately, each on its own average. All three rest on the same few days, and little in the usual process tests them against those days together.
Method
The plant is modeled. A 1,000 MW combined cycle plant at 6,500 Btu per kWh, run through every hour of 2011 to 2025 at ERCOT's North hub on actual day-ahead and real-time prices, and the gas that Texas plants reported paying to EIA. It earns energy margin only, knows the day-ahead price when it commits, and ignores minimum load and ramp limits, so it overstates earnings; its fixed costs leave out property tax and insurance, so it understates what it needs. The $5,000 case caps every price and changes nothing else.
Outages are modeled. Forced outages at the industry average rate, lasting two days on average (an assumption), and in the stress cases three times as likely in hours above $1,000 and, in half the histories, a four-day outage during Uri. Those two settings are also our assumptions. A plant that fails after selling day-ahead buys the power back at real-time prices, which is why a Uri outage costs more than the four days' share of margin. The contract case uses the same plant with 600 MW sold for the daytime hours at the 2020 to 2025 average on-peak price.
Requirements are illustrative. Build cost divided by a multiple, plus $12.12 per kW-year of fixed running costs. The 12.5x multiple comes from contracted peaking plants and is applied here to a combined cycle plant, as the price a long-contract buyer pays for contracted capacity, not as a build cost.
Sources and periods.
- Power prices: ERCOT MIS reports 13060 and 13061, historical day-ahead and real-time load zone and hub prices, 2011 to 2025. Reserve prices: ERCOT MIS report 13091, day-ahead ancillary service clearing prices, 2015 to 2025; the highest up-service price each hour, summed by day.
- Gas: EIA daily Henry Hub spot price, plus the monthly cost Texas plants reported in EIA-923 fuel receipts. EIA-923 tags plants by balancing authority only from 2018, so for 2011 to 2017 a plant counts as ERCOT if it was coded ERCOT in 2018. February 2021's reported monthly cost is placed on the storm days.
- Fleet efficiency: 7,176 Btu per kWh, the 2025 average of US gas combined cycle plants, computed by us from EIA-923.
- Forced outage rate: NERC, 2025 State of Reliability, weighted equivalent forced outage rate, all conventional generation, 2024.
- Build costs: EIA and Sargent & Lundy, AEO2025 capital cost estimates, combined cycle case, $868 per kW in 2023 dollars. Entergy Corporation Form 10-K for 2025, filed 19 February 2026: Delta Blues and Vicksburg Advanced Power Stations, 754 MW, $1.2 billion each; Legend Power Station, 754 MW, PUCT cost cap of $1.6 billion including interconnection, network upgrades and financing costs during construction; Jefferson Power Station, about 754 MW, $1,602 million; Waterford 6 and Westlake, 754 MW each, about $2,027 million and $2,091 million. Kansas Corporation Commission, docket 25-EKCE-207-PRE: Evergy Kansas Central's 50 percent shares of the 710 MW Viola and McNew plants, $788.75 million and $800.519 million excluding financing costs during construction. What each figure covers differs, so they are a range, not like for like.
- Multiples: Williams, Forms 8-K, 3 March and 1 October 2025 ("approximately 5x EBITDA" build multiple on 10-year contracts); TransAlta, Form 6-K Exhibit 99.1, 3 June 2026 (US$1.0 billion for two contracted Colorado peaking plants, 318 MW, with "approximately US$80 million" of annual adjusted EBITDA; 12.5x computed by us).
- Uri: FERC, NERC and Regional Entity staff, "February 2021 Cold Weather Grid Operations: Preliminary Findings and Recommendations", 23 September 2021. Brazos Electric Power Cooperative, news release, 1 March 2021; ERCOT letter to the Public Utility Commission of Texas on the Brazos settlement, 2 November 2022. Vistra Corp., Form 8-K Exhibit 99.1, 26 February and 26 April 2021.
- Offer cap: Potomac Economics, ERCOT Independent Market Monitor, 2022 State of the Market Report ($5,000 from 1 January 2022).
Questions, corrections or disagreement on any of this are welcome: kris@tafelpower.com
More from Insights
October 25, 2026
The AI Campus Could Leave America. So Far It Has Not.
Every US site now has two gates: whether the grid can serve it, and whether the local utility's rates make the data center pay its own way.
October 10, 2026
Where Does the Money From a Data Center Power Plant Go?
We modeled a 1,000 MW gas plant built to power a data center. Lenders and investors collect about seven times what the companies that build it earn, for putting up the money.